Pfizer Inc.'s management explains the business in its own materials. The slides below do the most of that work, pulled from the documents preserved in Sources. Each source link opens the complete presentation at that slide in a new tab.
Management's fullest current statement of the whole company: FY2025 results, the 2026 strategy, the obesity bet and capital allocation. · Open the full document →
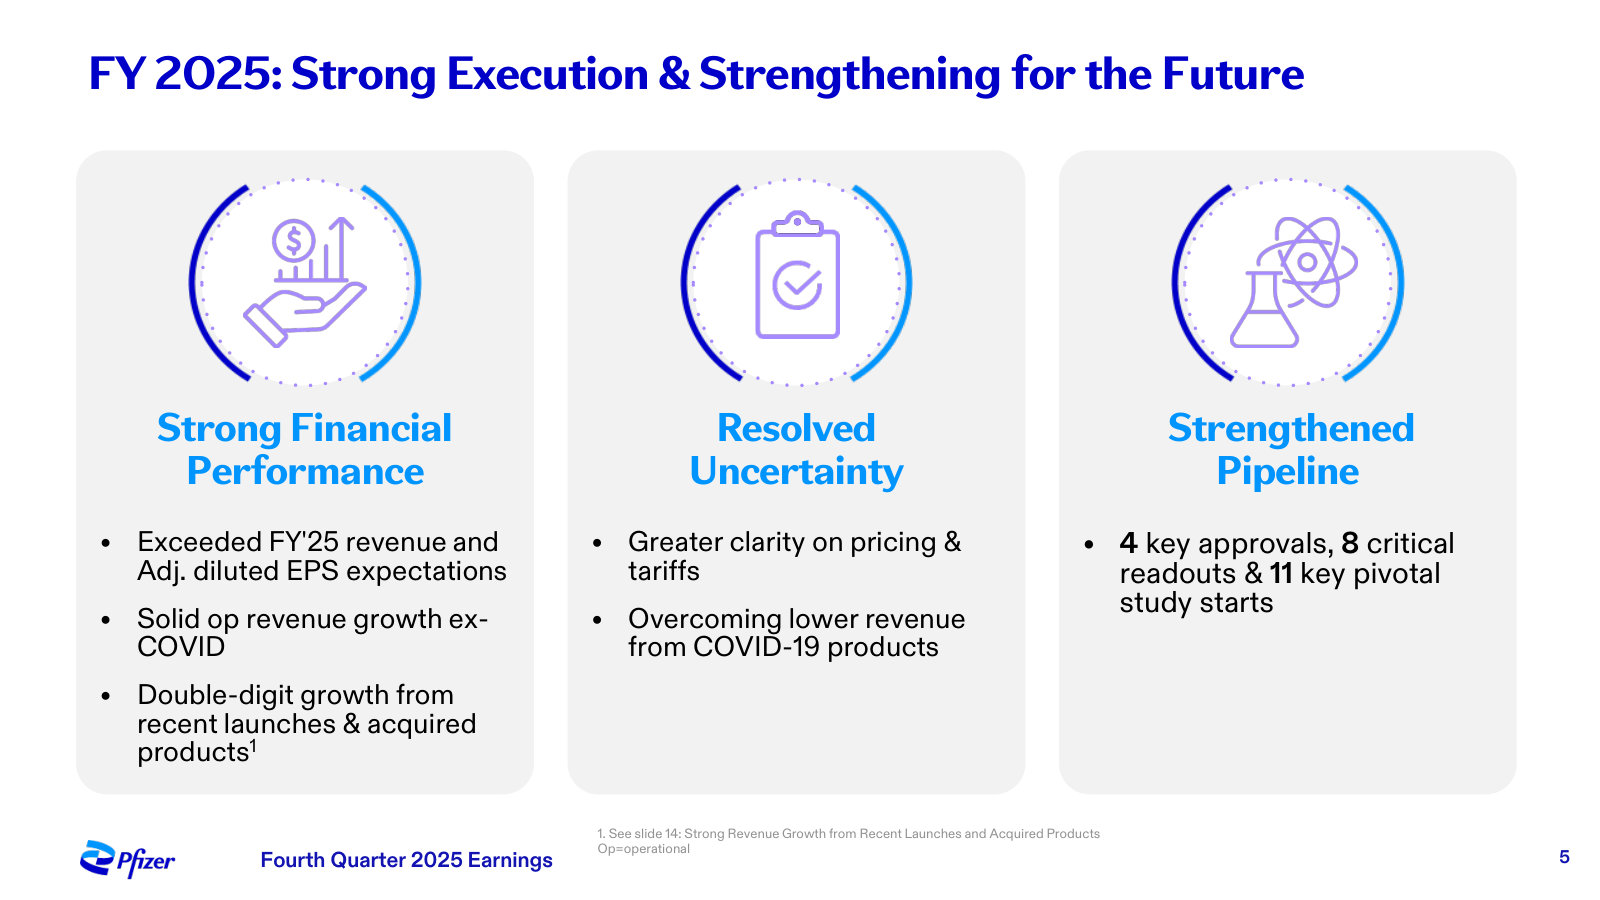
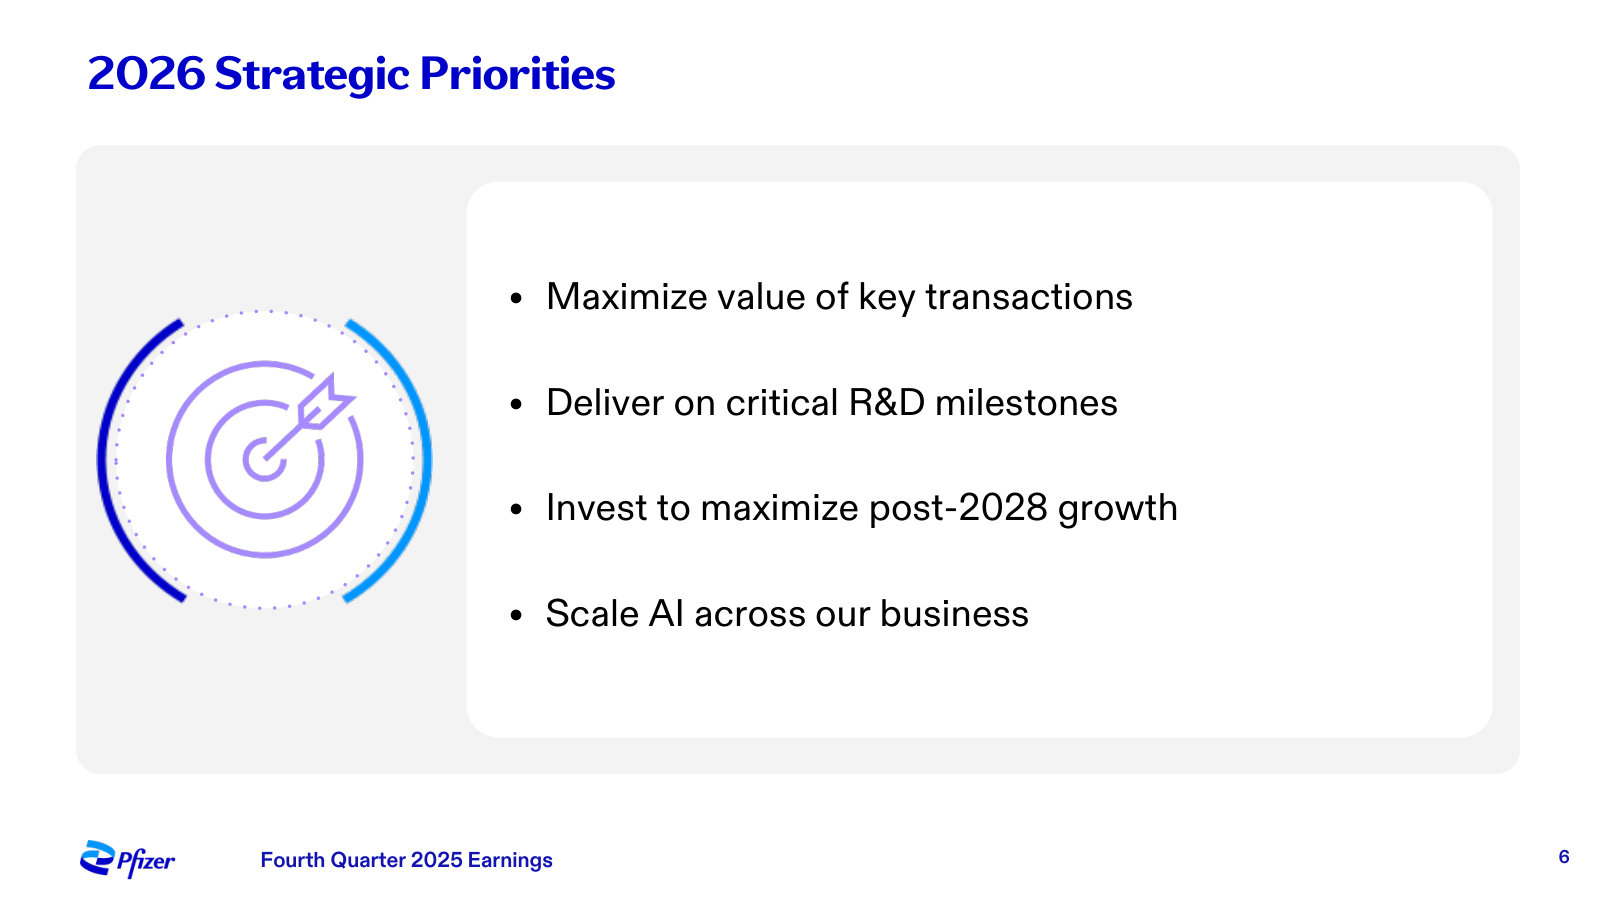
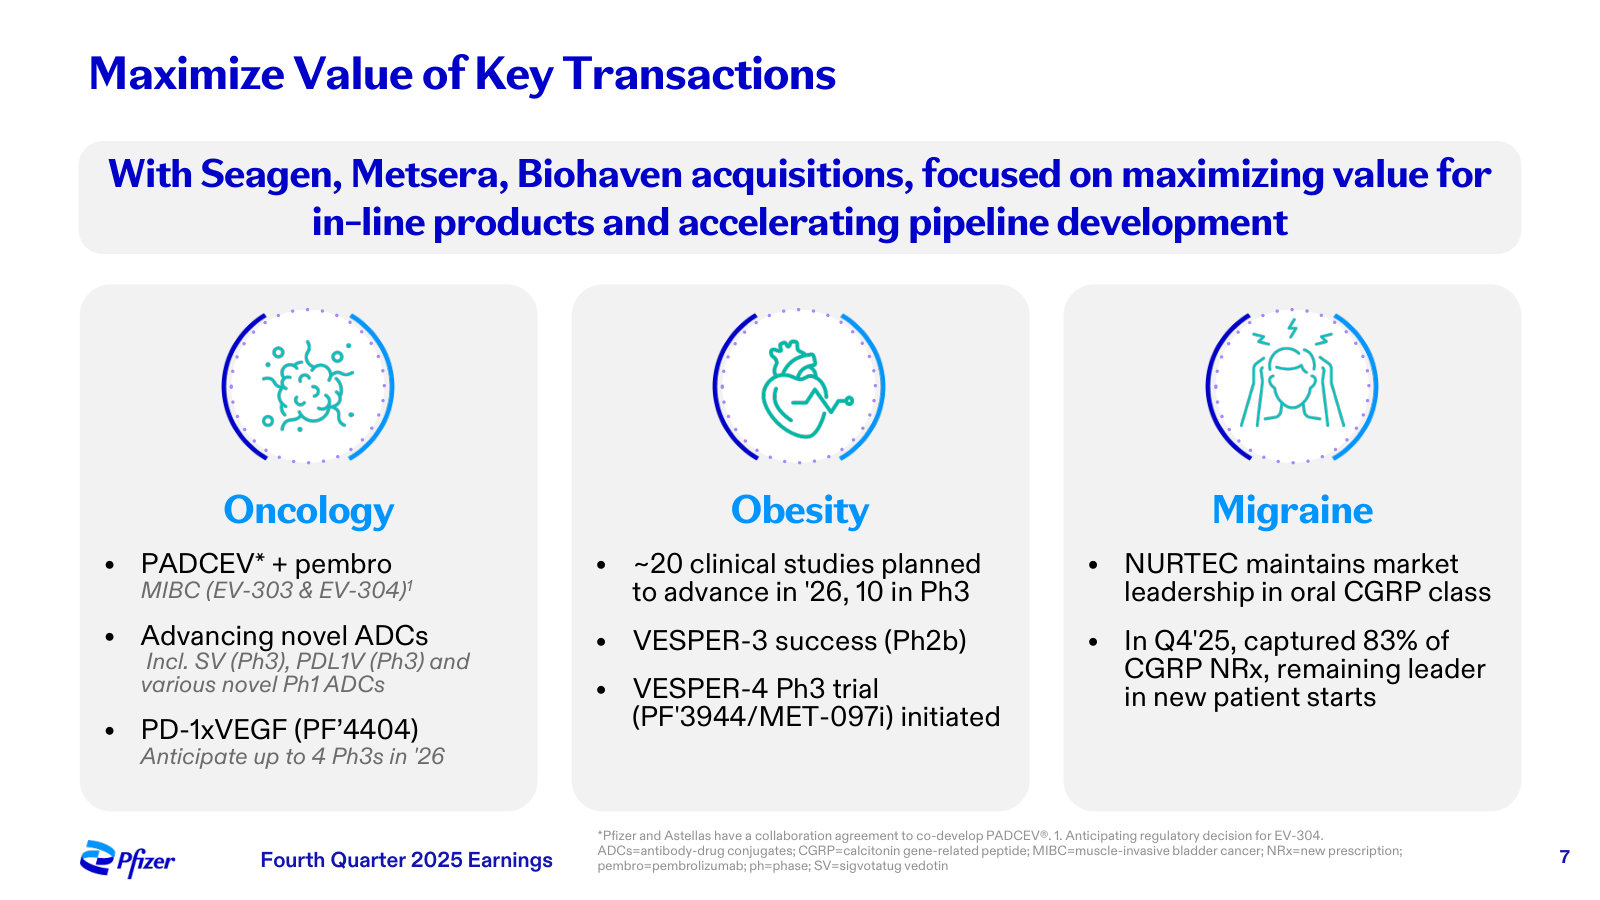
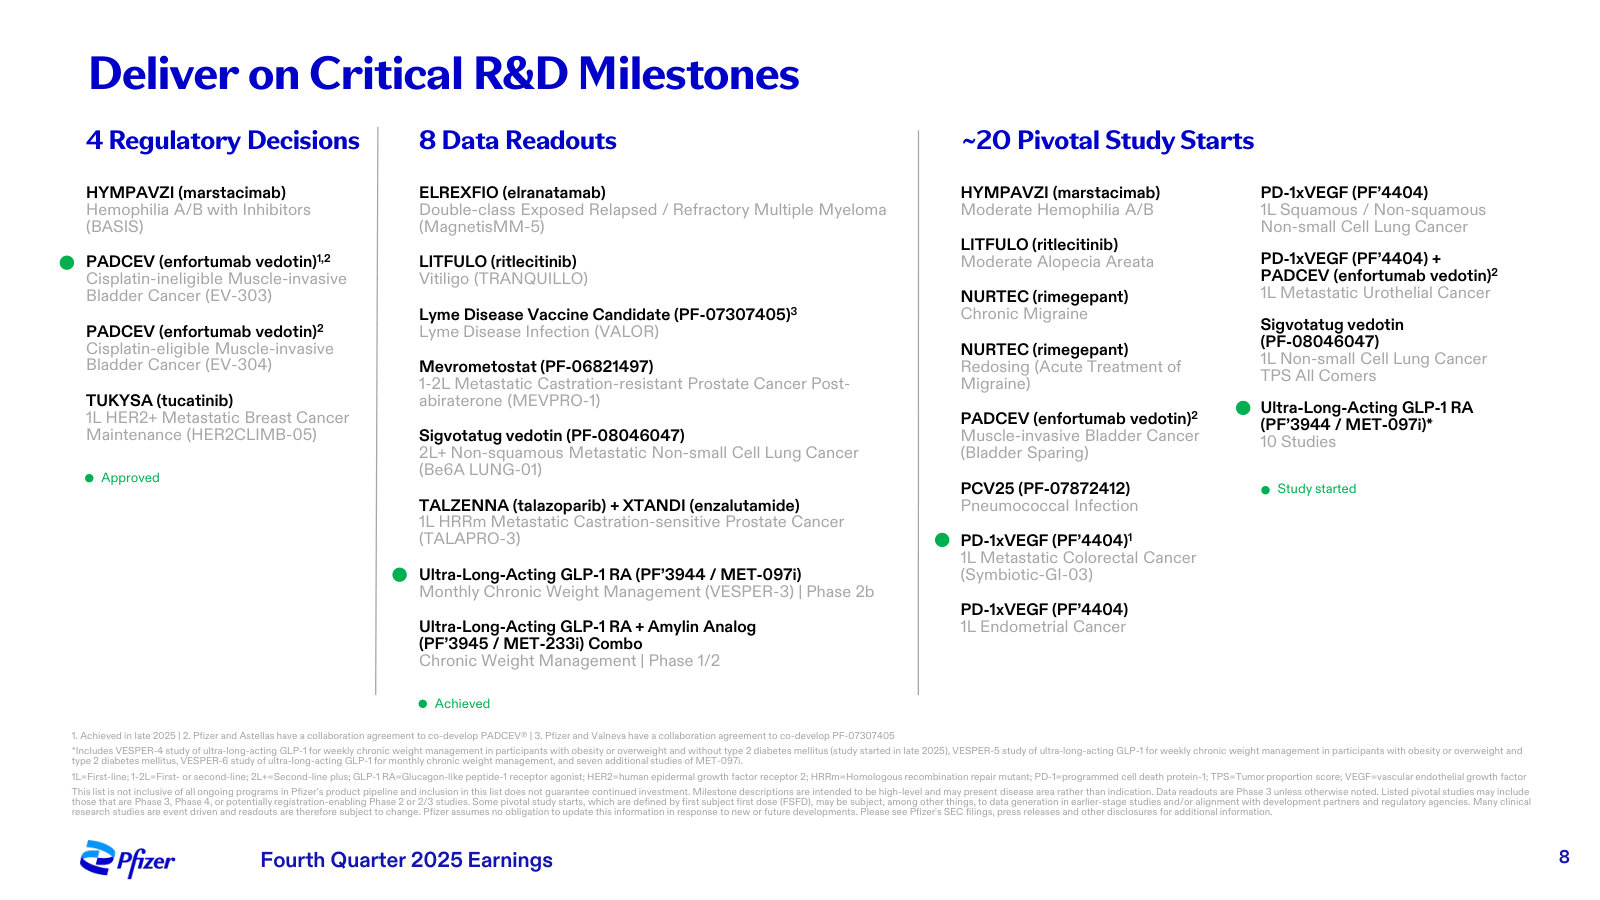
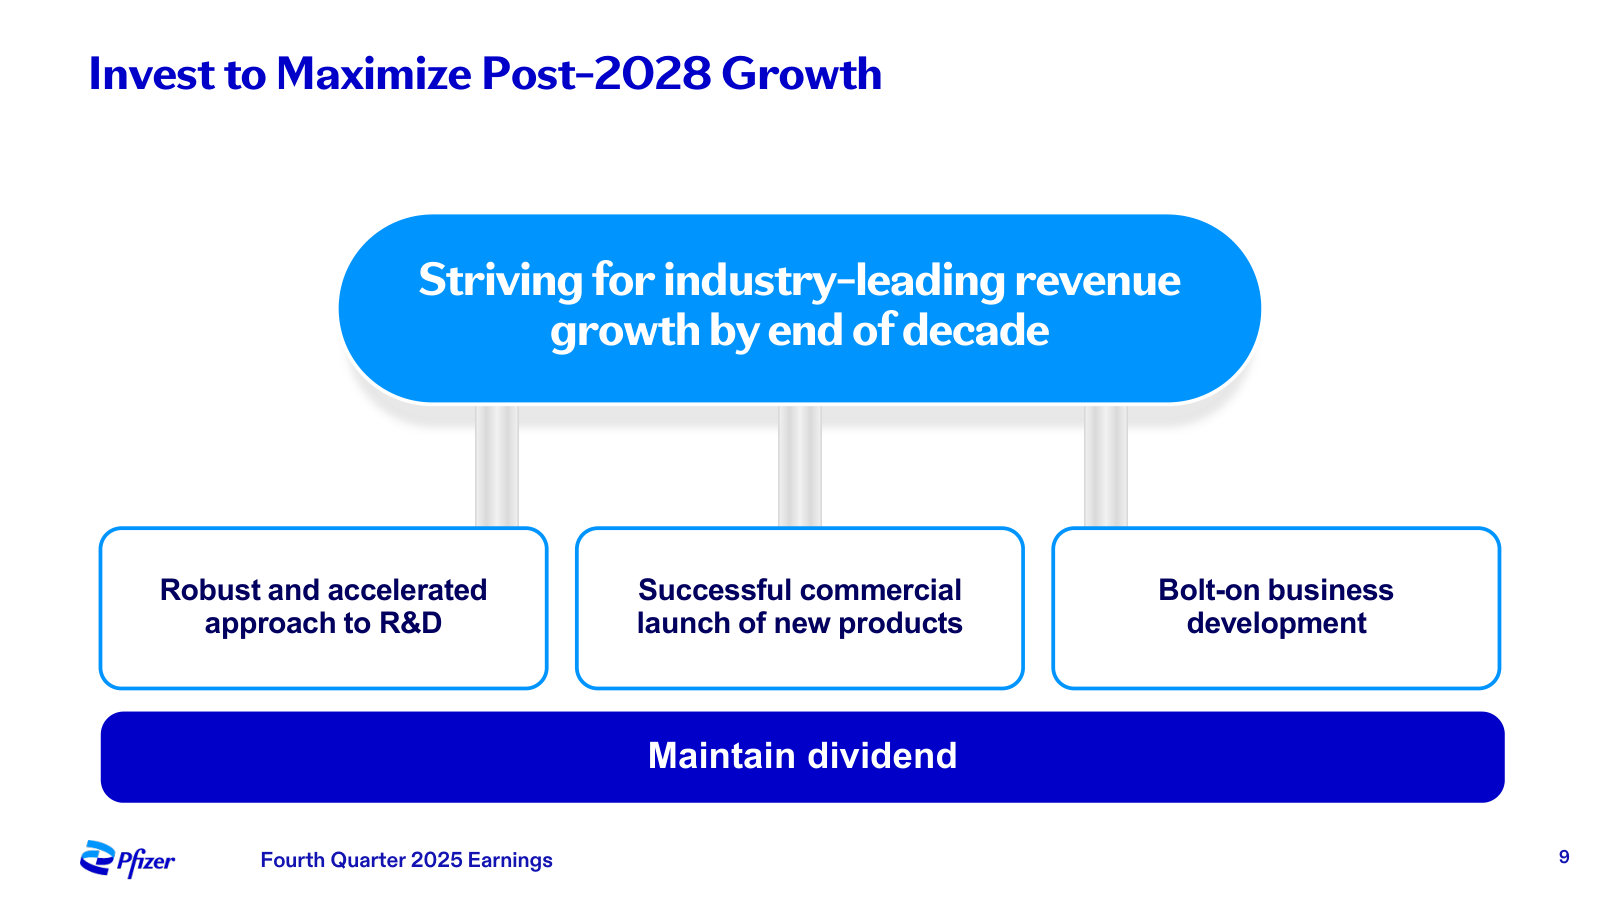
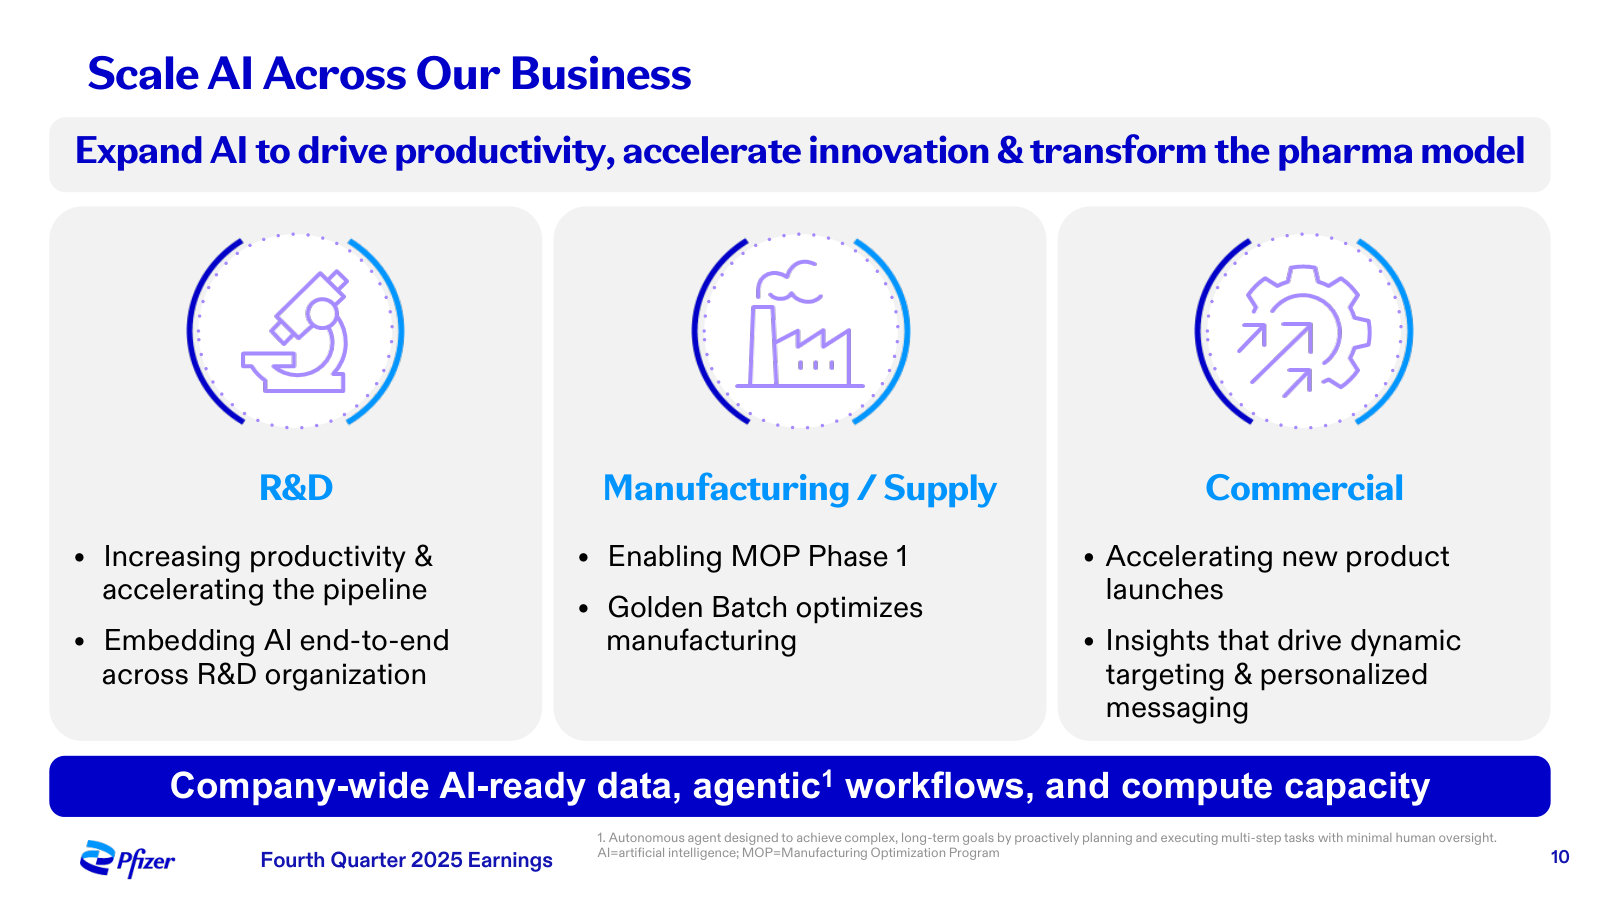
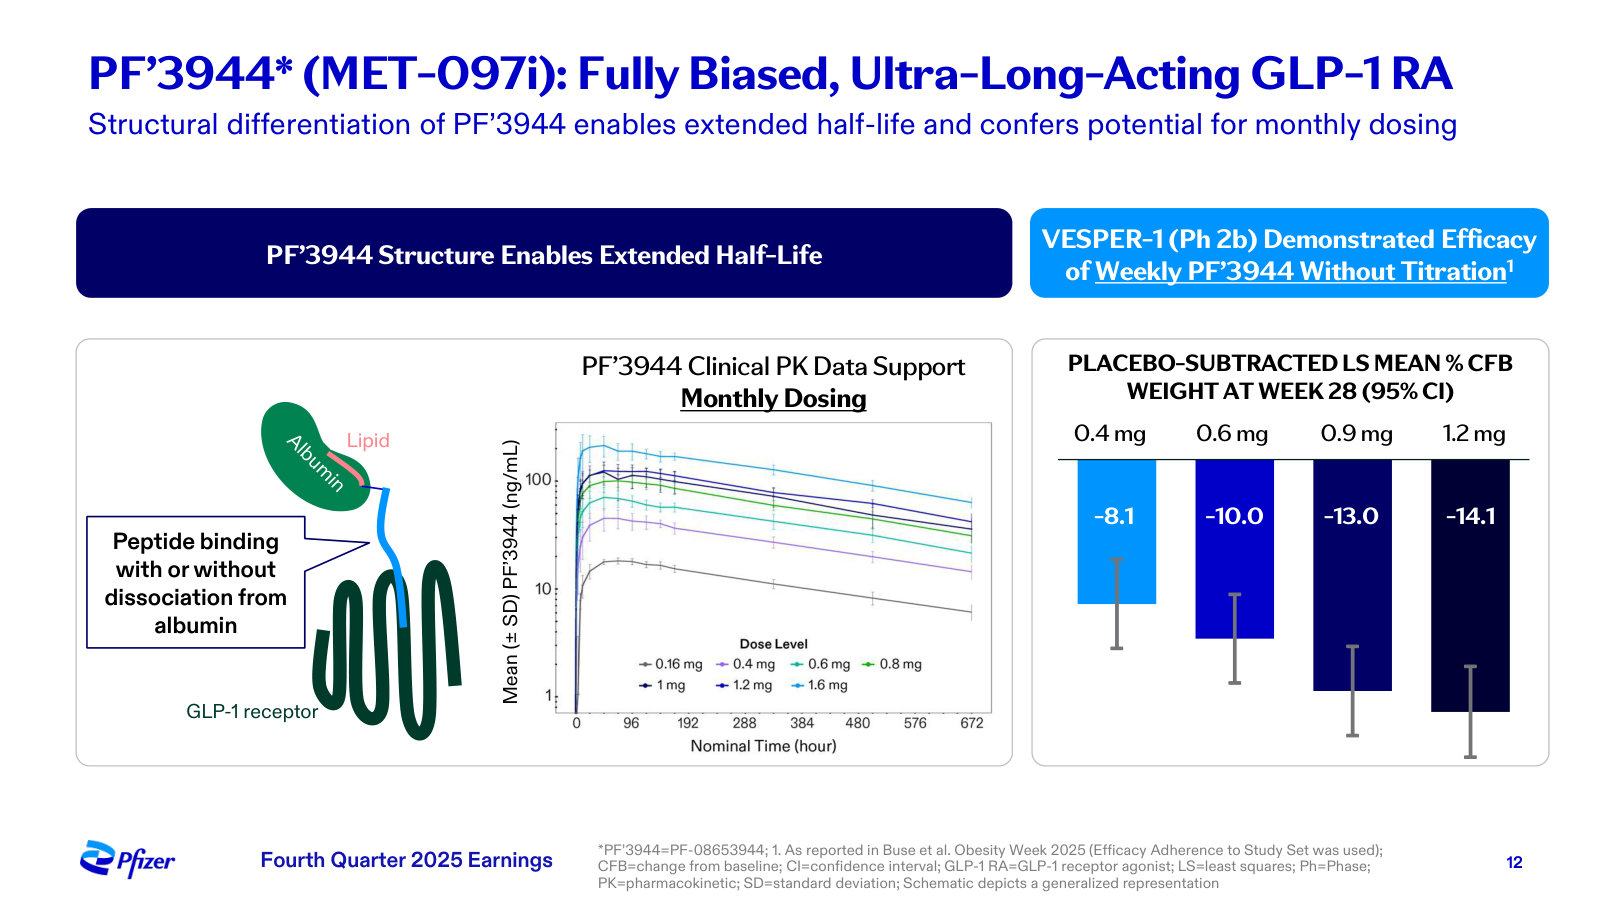
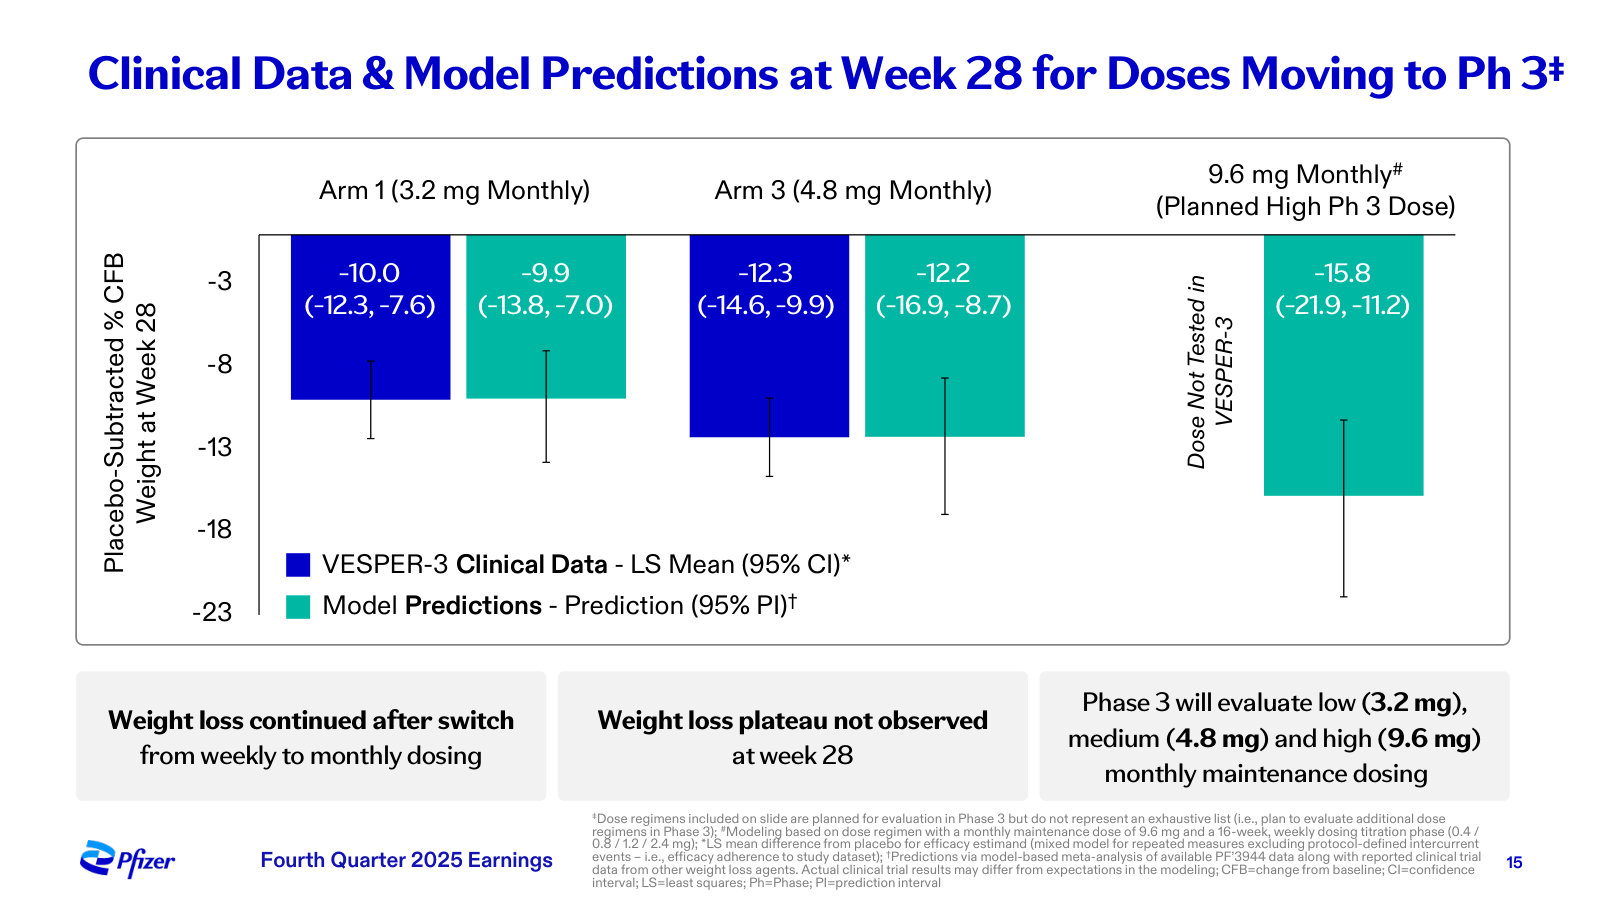
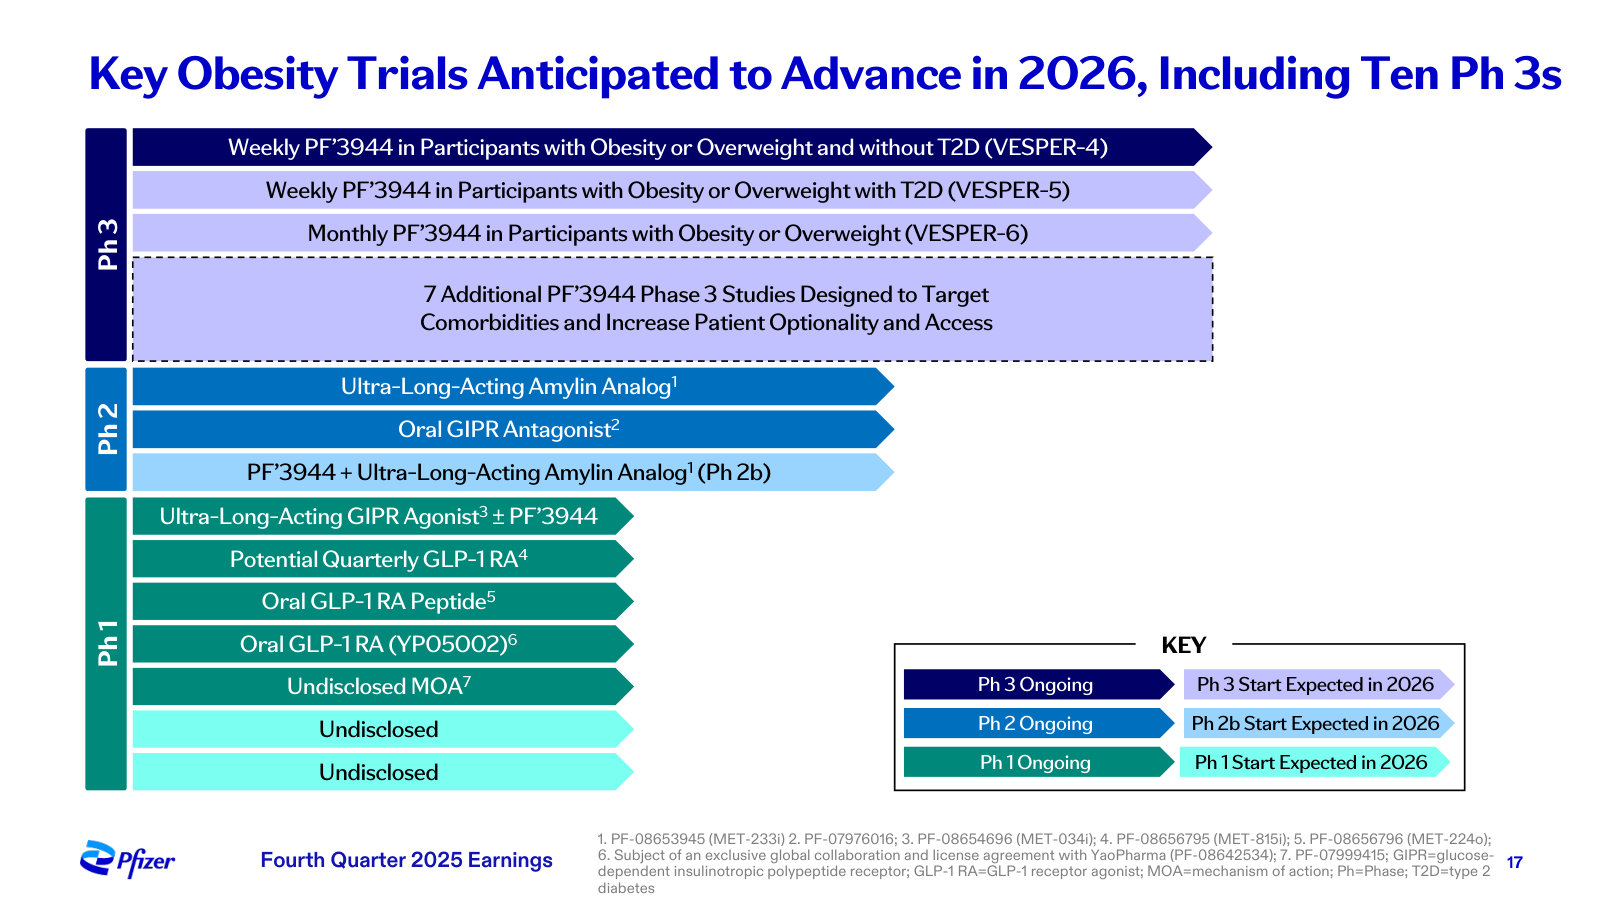
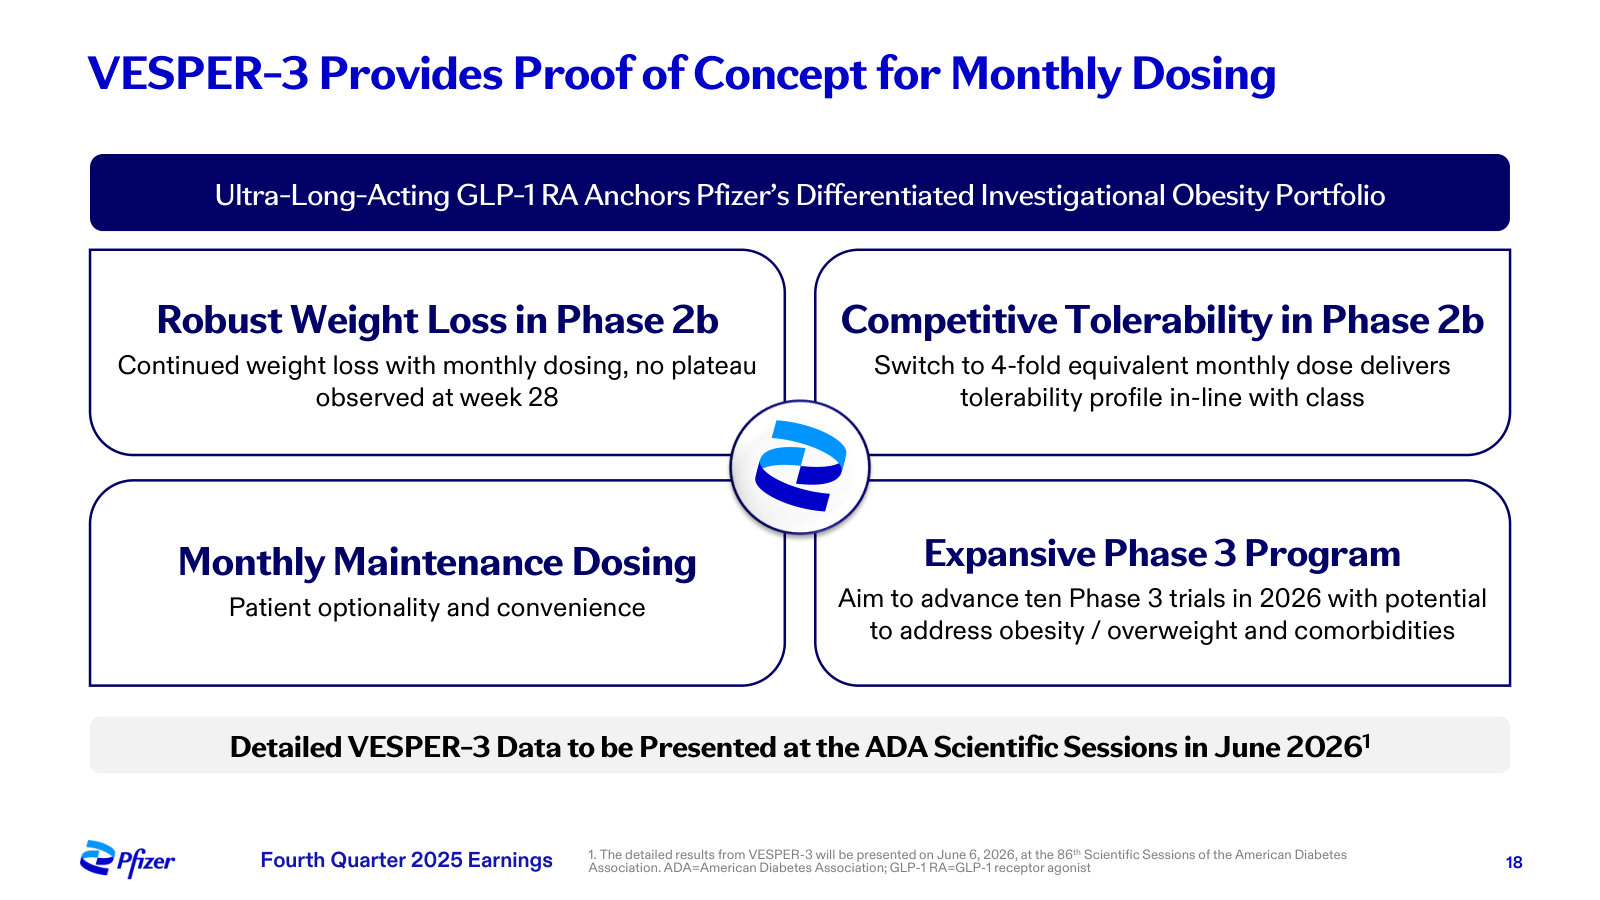
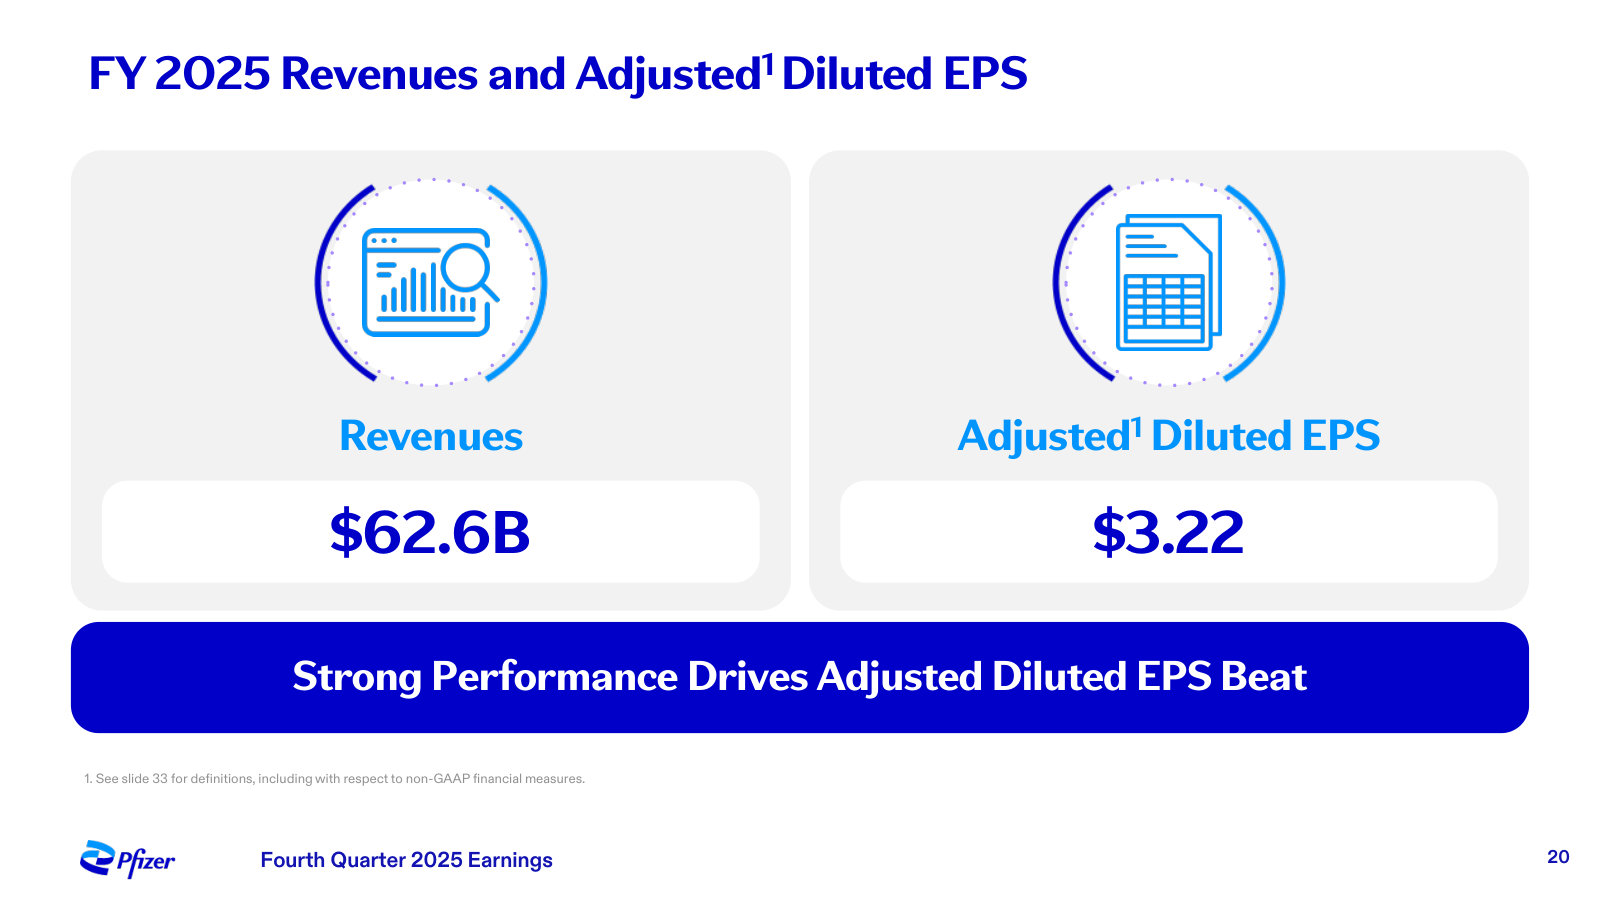
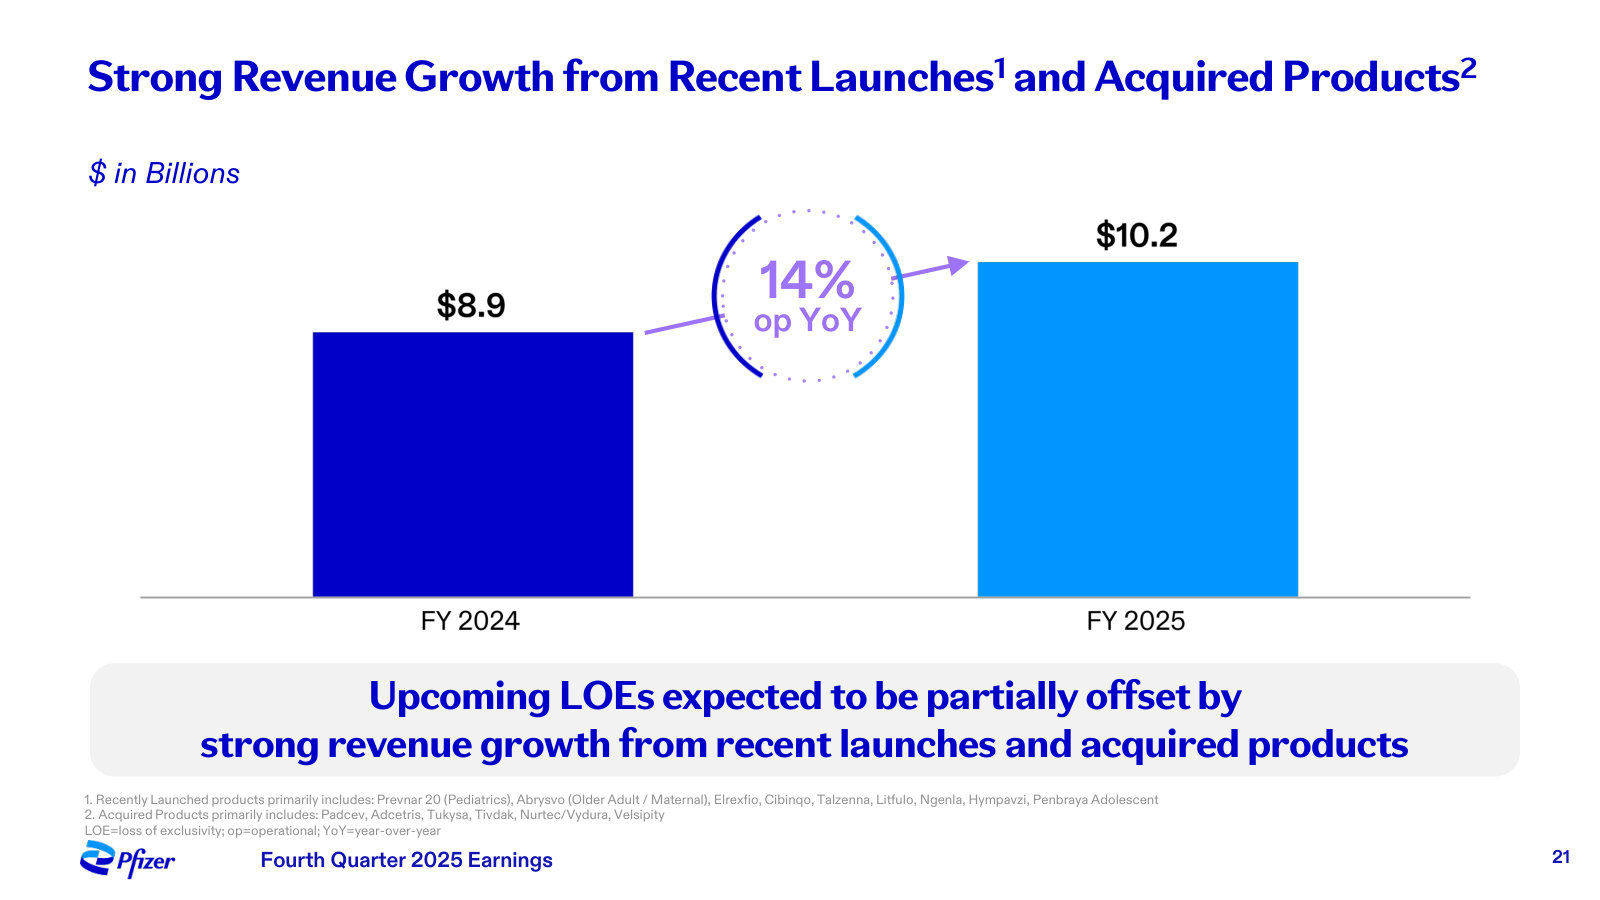
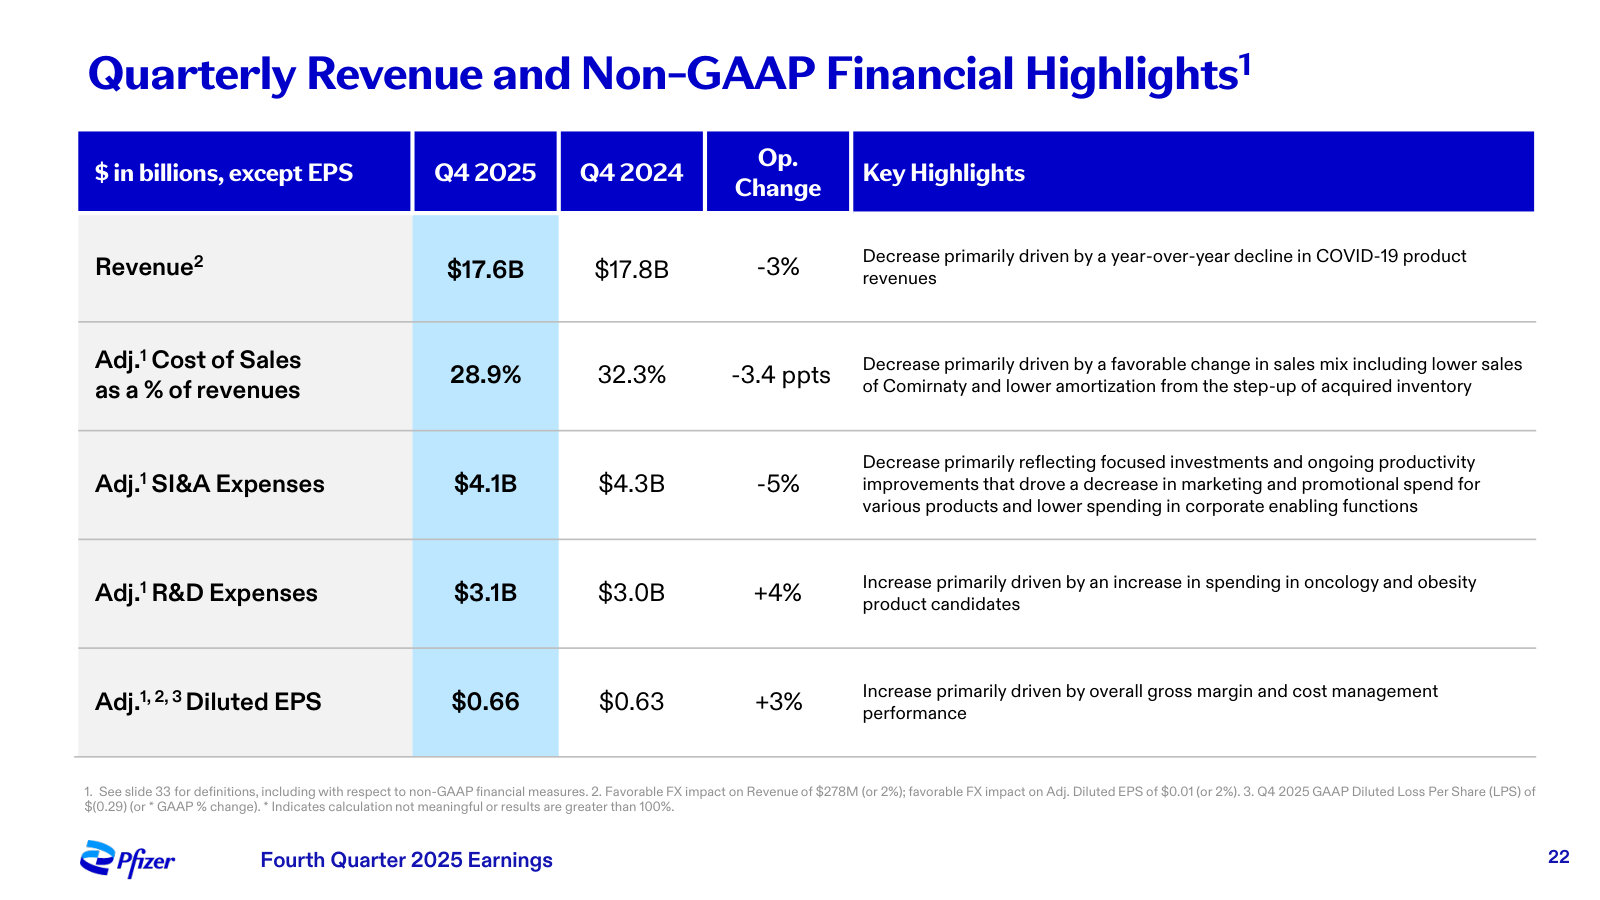
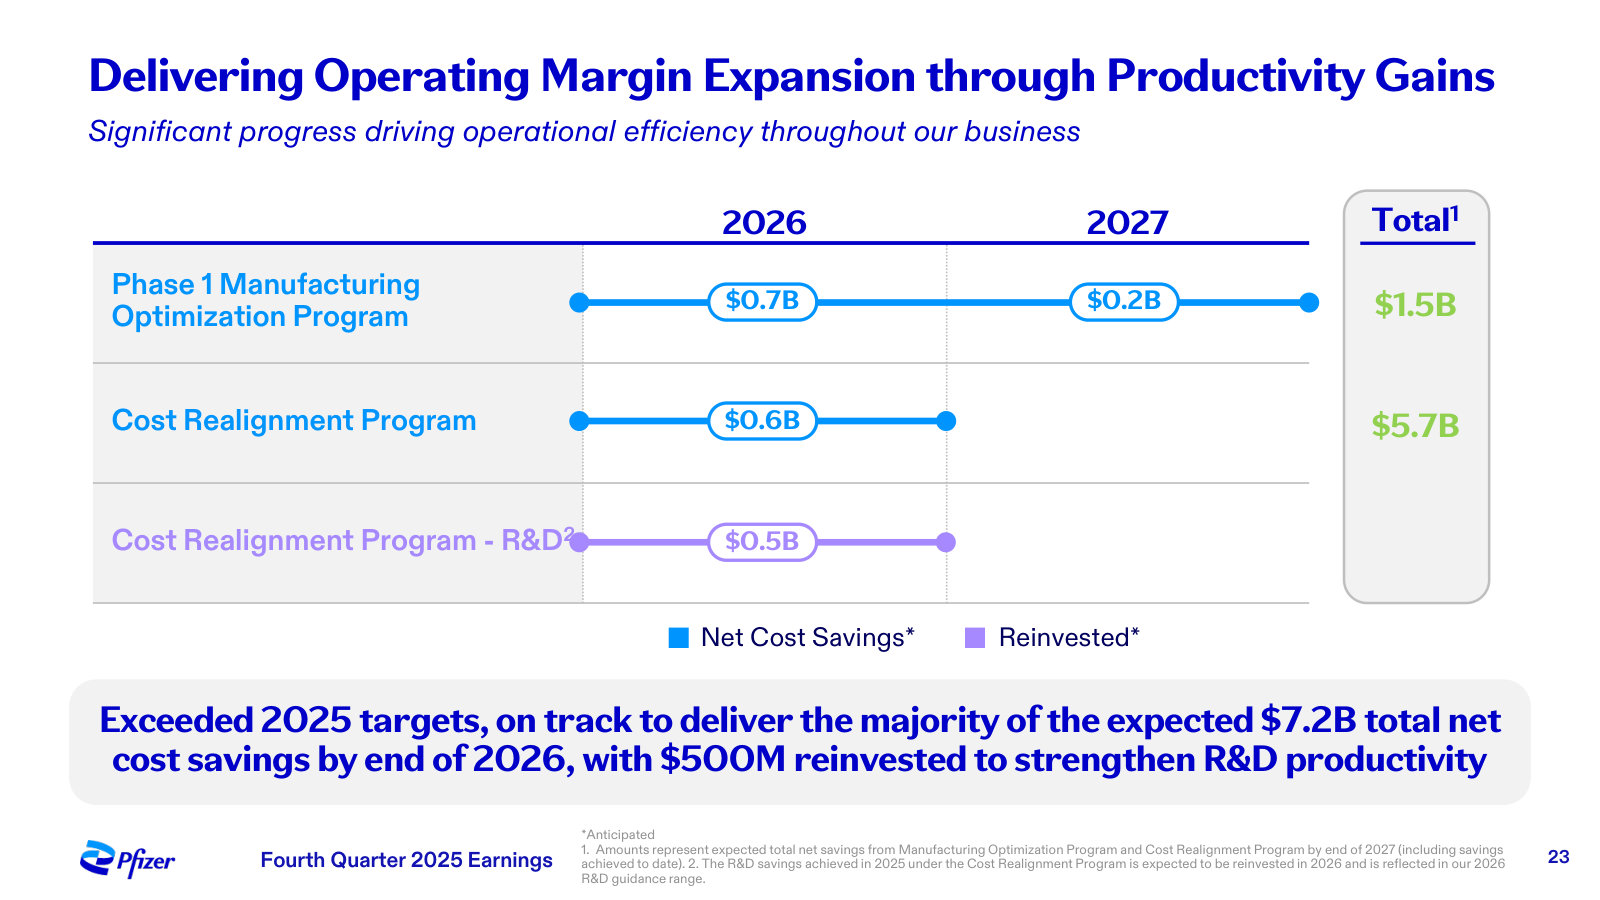
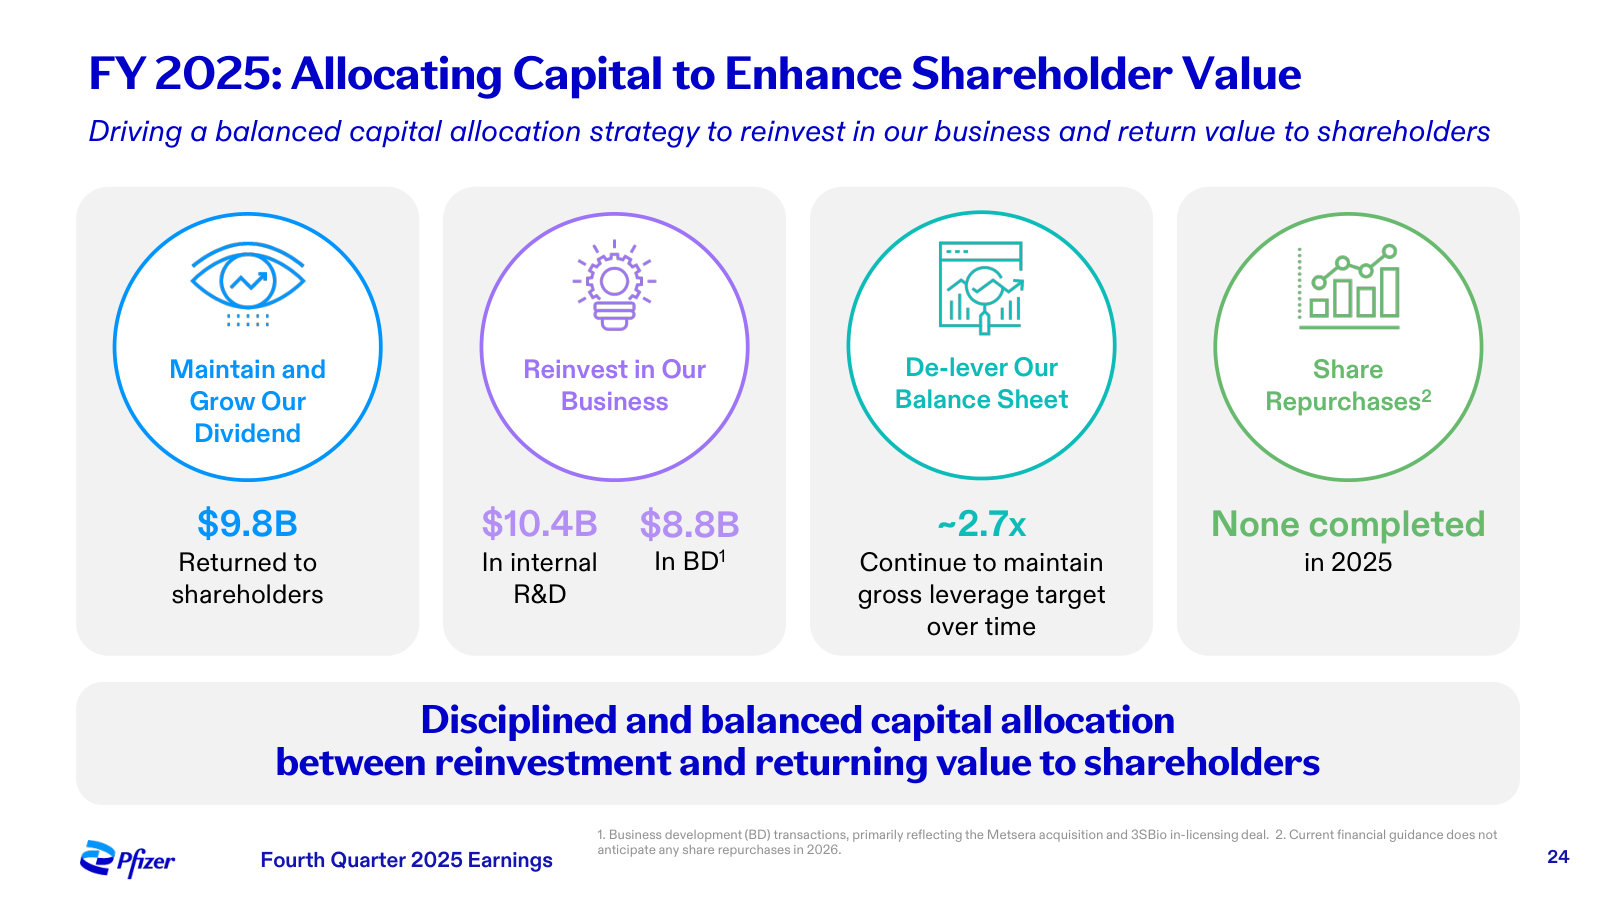
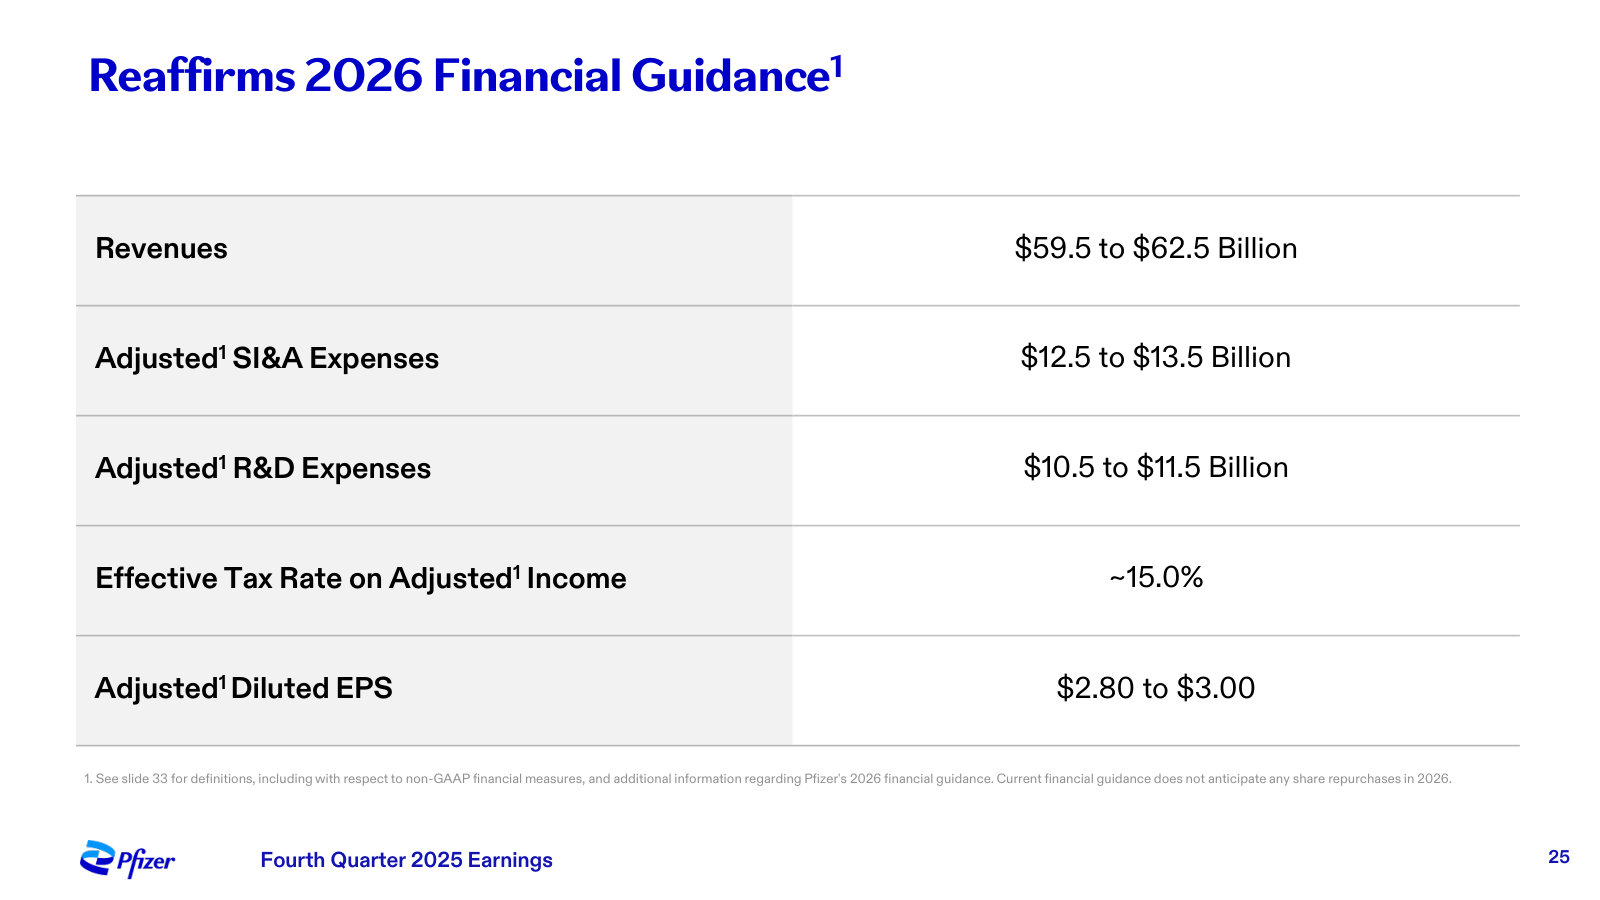
p. 5 — FY2025 in three parts: a financial beat, resolved COVID/pricing uncertainty, and a strengthened pipeline into 2026. · Open the full presentation →p. 6 — The four priorities framing 2026 — integrate recent deals, hit R&D milestones, invest for post-2028 growth, scale AI. · Open the full presentation →p. 7 — Where the recent acquisitions land — the oncology (Seagen), obesity (Metsera) and migraine (Biohaven) franchises they built. · Open the full presentation →p. 8 — Management's 2026 milestone map: 4 regulatory decisions, 8 data readouts and ~20 pivotal study starts across the pipeline. · Open the full presentation →p. 9 — The post-2028 growth plan — accelerated R&D, new launches and bolt-on deals — with the dividend held as the base. · Open the full presentation →p. 10 — How Pfizer intends to use AI across R&D, manufacturing and commercial to lift productivity. · Open the full presentation →p. 12 — The obesity bet explained: PF'3944, an ultra-long-acting GLP-1 engineered for monthly dosing, and its Phase 2b weight-loss curve. · Open the full presentation →p. 15 — VESPER-3 weight loss versus placebo for the doses advancing to Phase 3 — the core evidence behind the obesity program. · Open the full presentation →p. 17 — The full obesity pipeline: ten Phase 3 starts planned for 2026 plus earlier-stage GLP-1, amylin and oral candidates. · Open the full presentation →p. 18 — Why the obesity data matter — monthly dosing, competitive tolerability and an expansive Phase 3 program, summarized. · Open the full presentation →p. 20 — Full-year 2025 scorecard: $62.6B revenue and $3.22 adjusted diluted EPS. · Open the full presentation →p. 21 — The offset to patent expiries — recently launched and acquired products grew 14% to $10.2B. · Open the full presentation →p. 22 — Q4 2025 by the numbers — revenue, cost of sales, SI&A, R&D and adjusted EPS versus a year earlier. · Open the full presentation →p. 23 — The margin story: ~$7.2B of net cost savings from the realignment and manufacturing programs through 2027. · Open the full presentation →p. 24 — How 2025 capital was allocated — $9.8B to shareholders, $10.4B internal R&D, $8.8B business development, plus deleveraging. · Open the full presentation →p. 25 — The 2026 guidance in full — revenue, expense, tax-rate and adjusted-EPS ranges. · Open the full presentation →
The one deep-dive investor day in the corpus, on Pfizer's central growth engine — the post-Seagen oncology business, its platform, portfolio and 2030 ambition. · Open the full document →
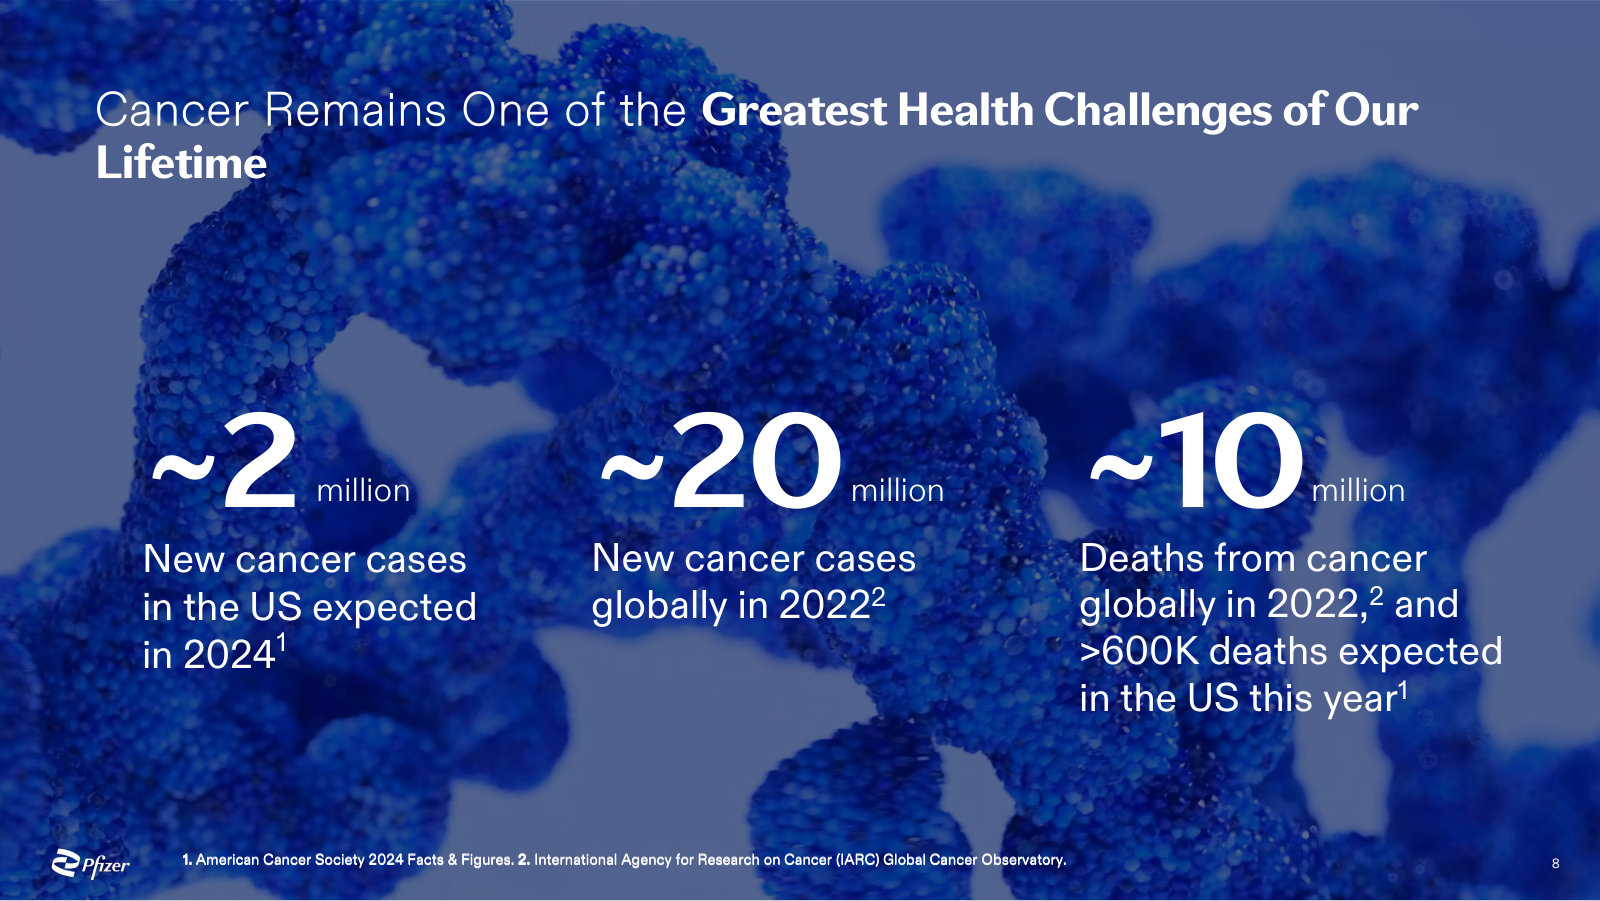
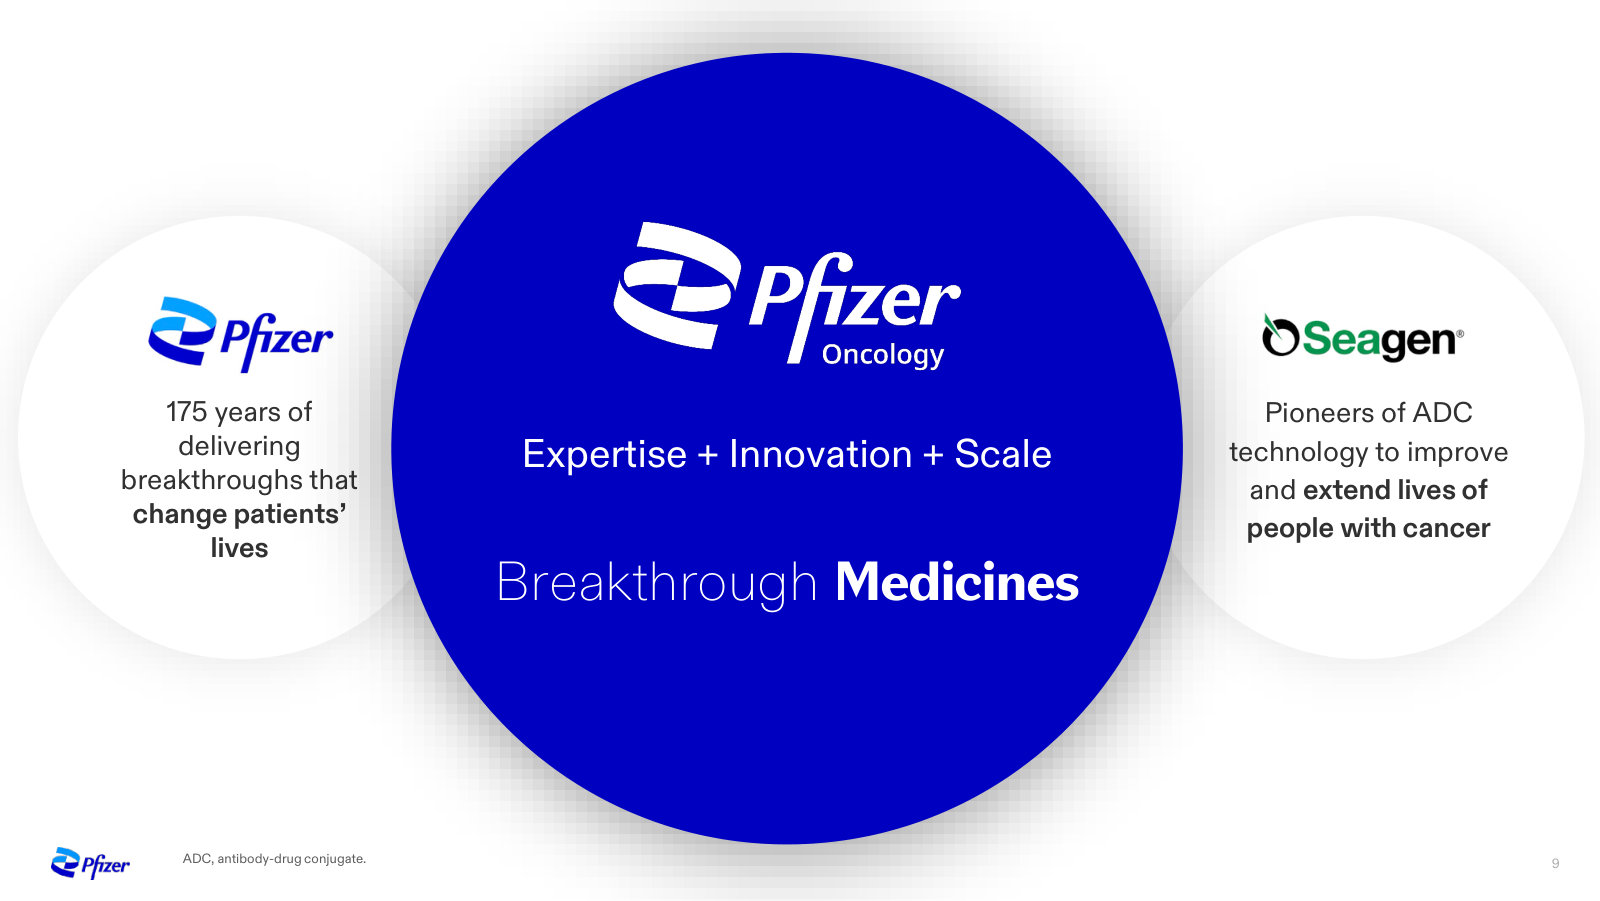
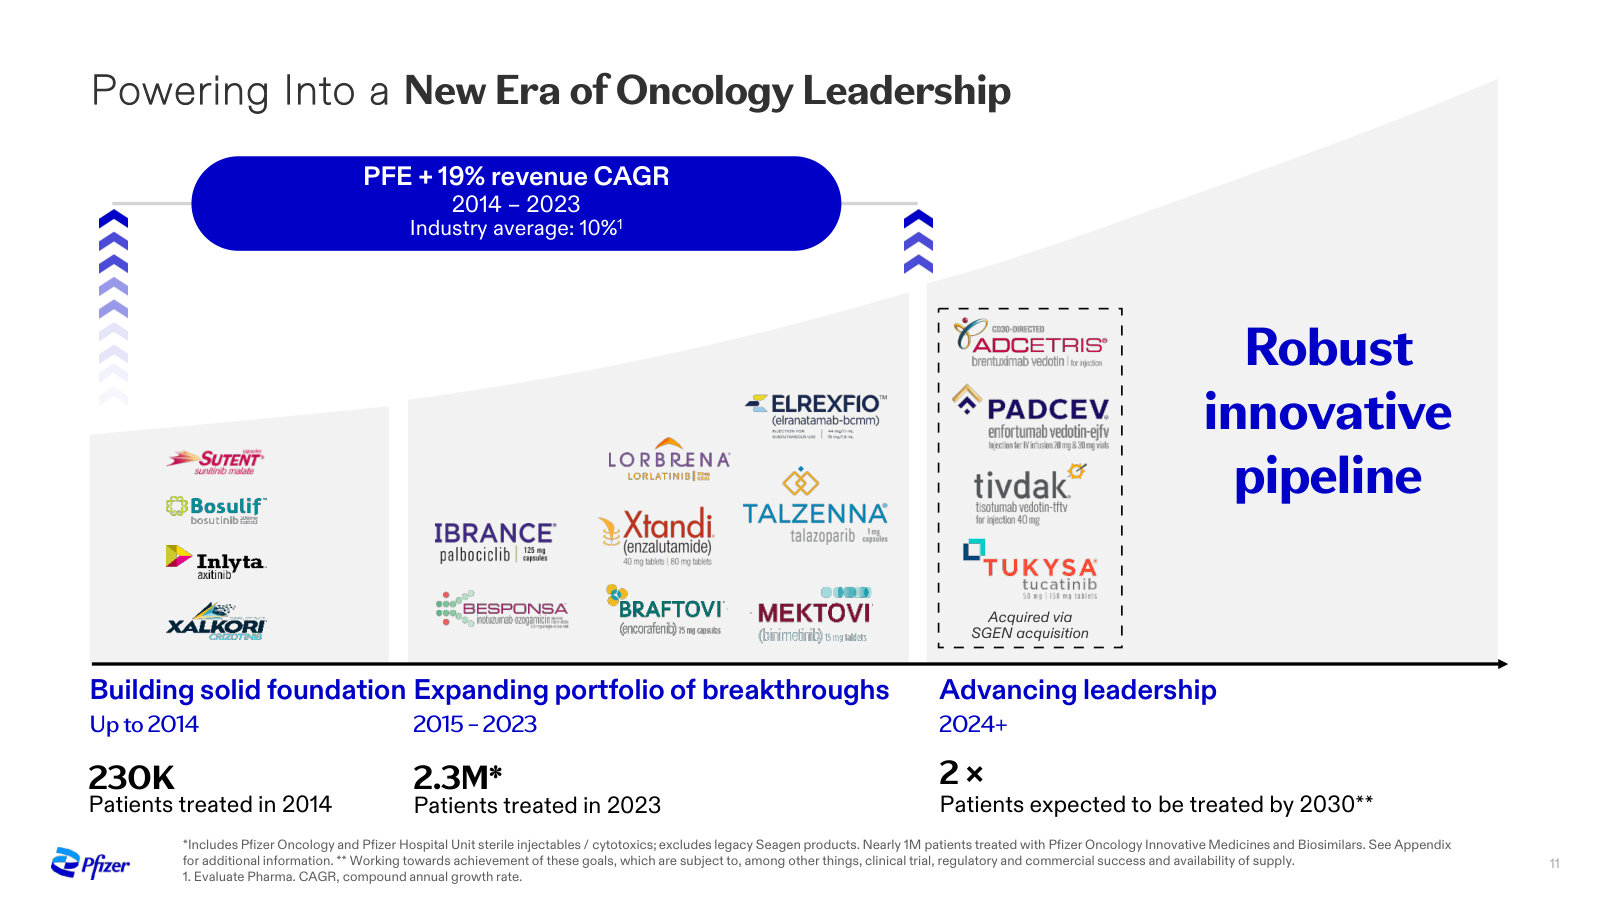
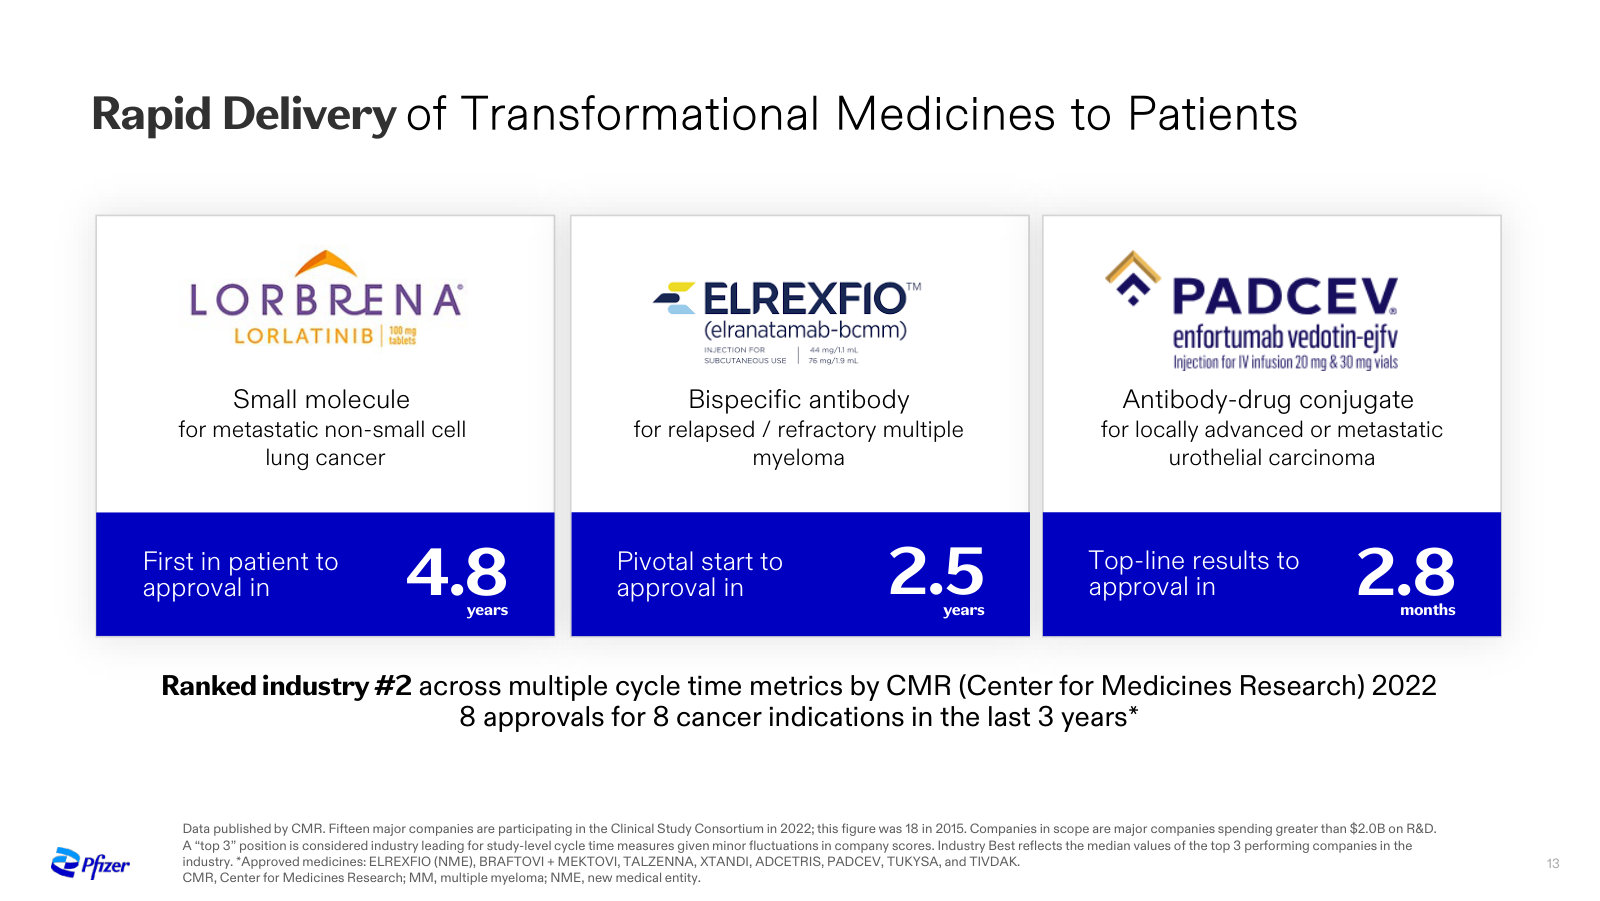
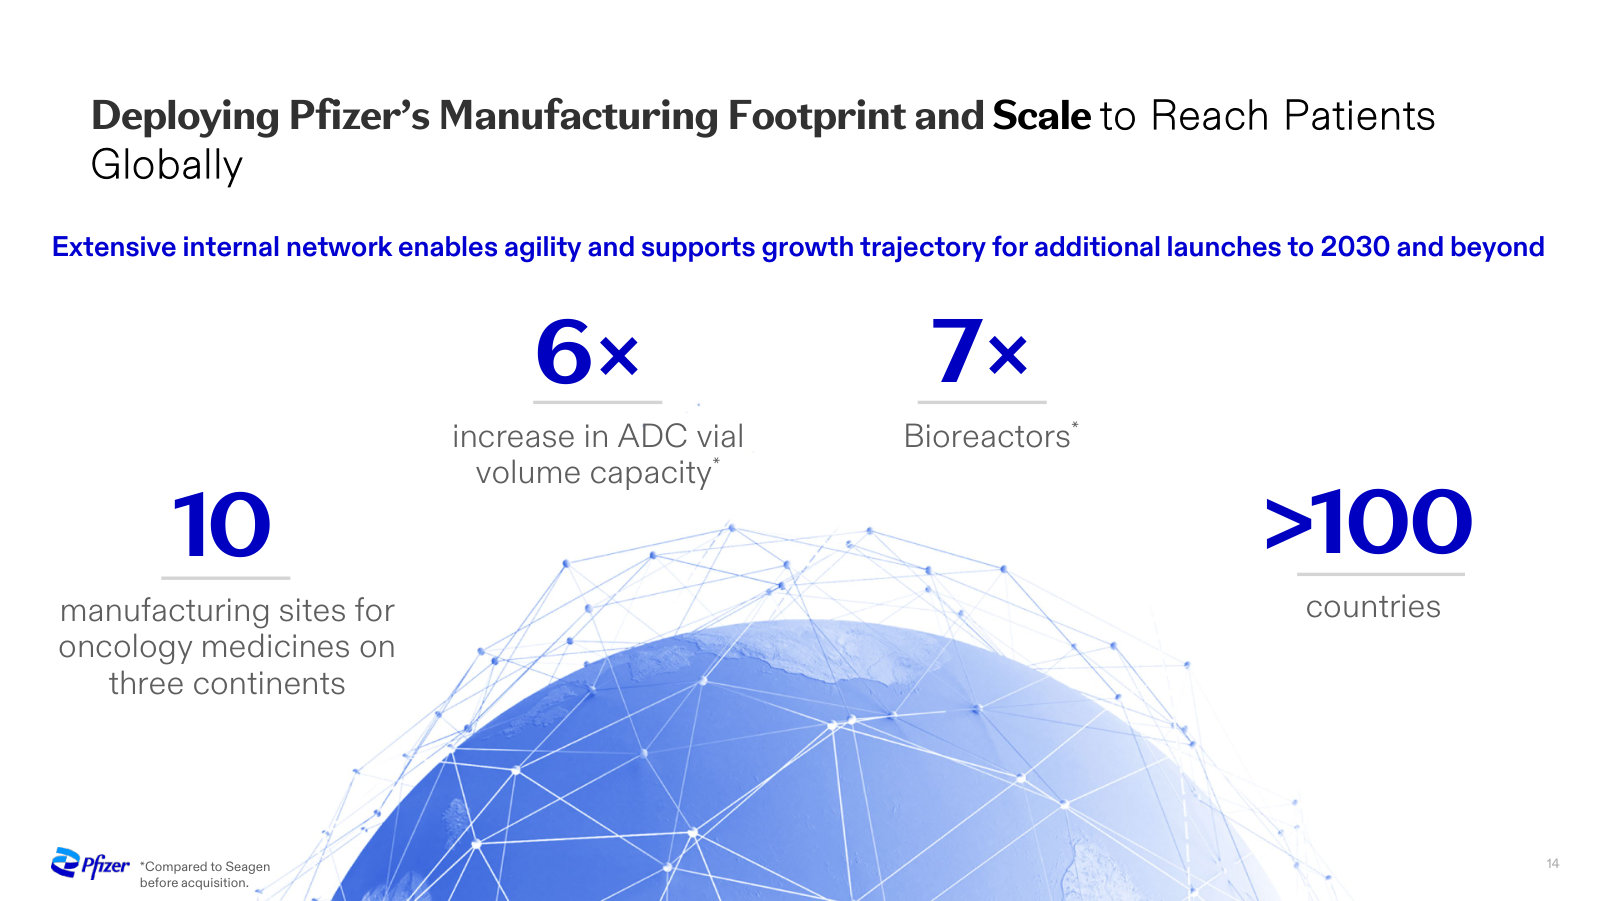
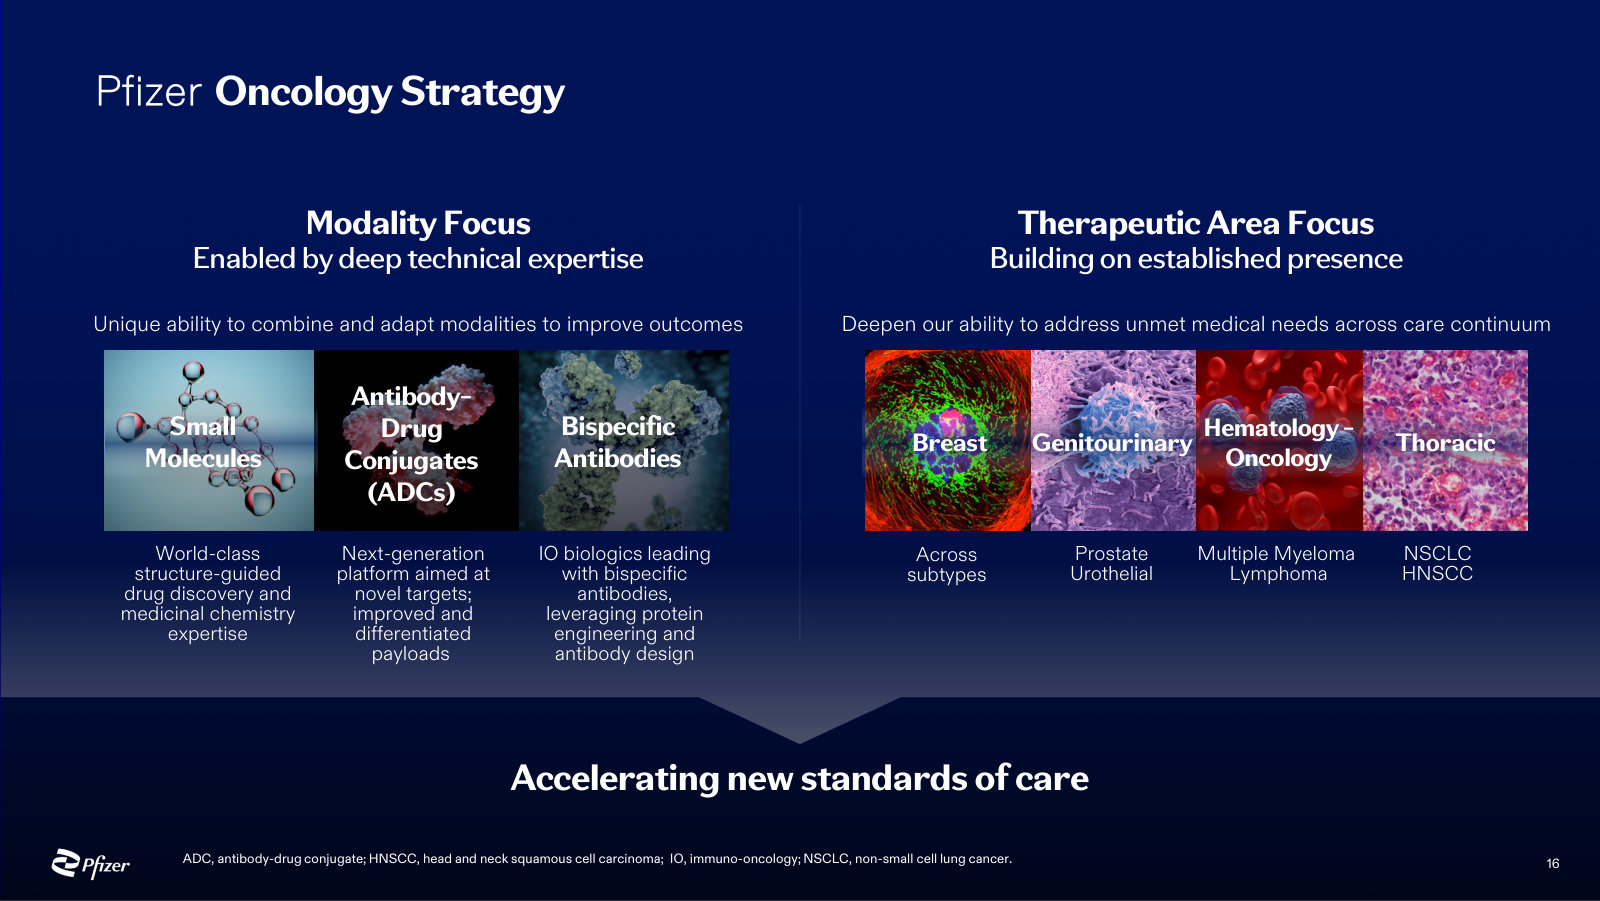
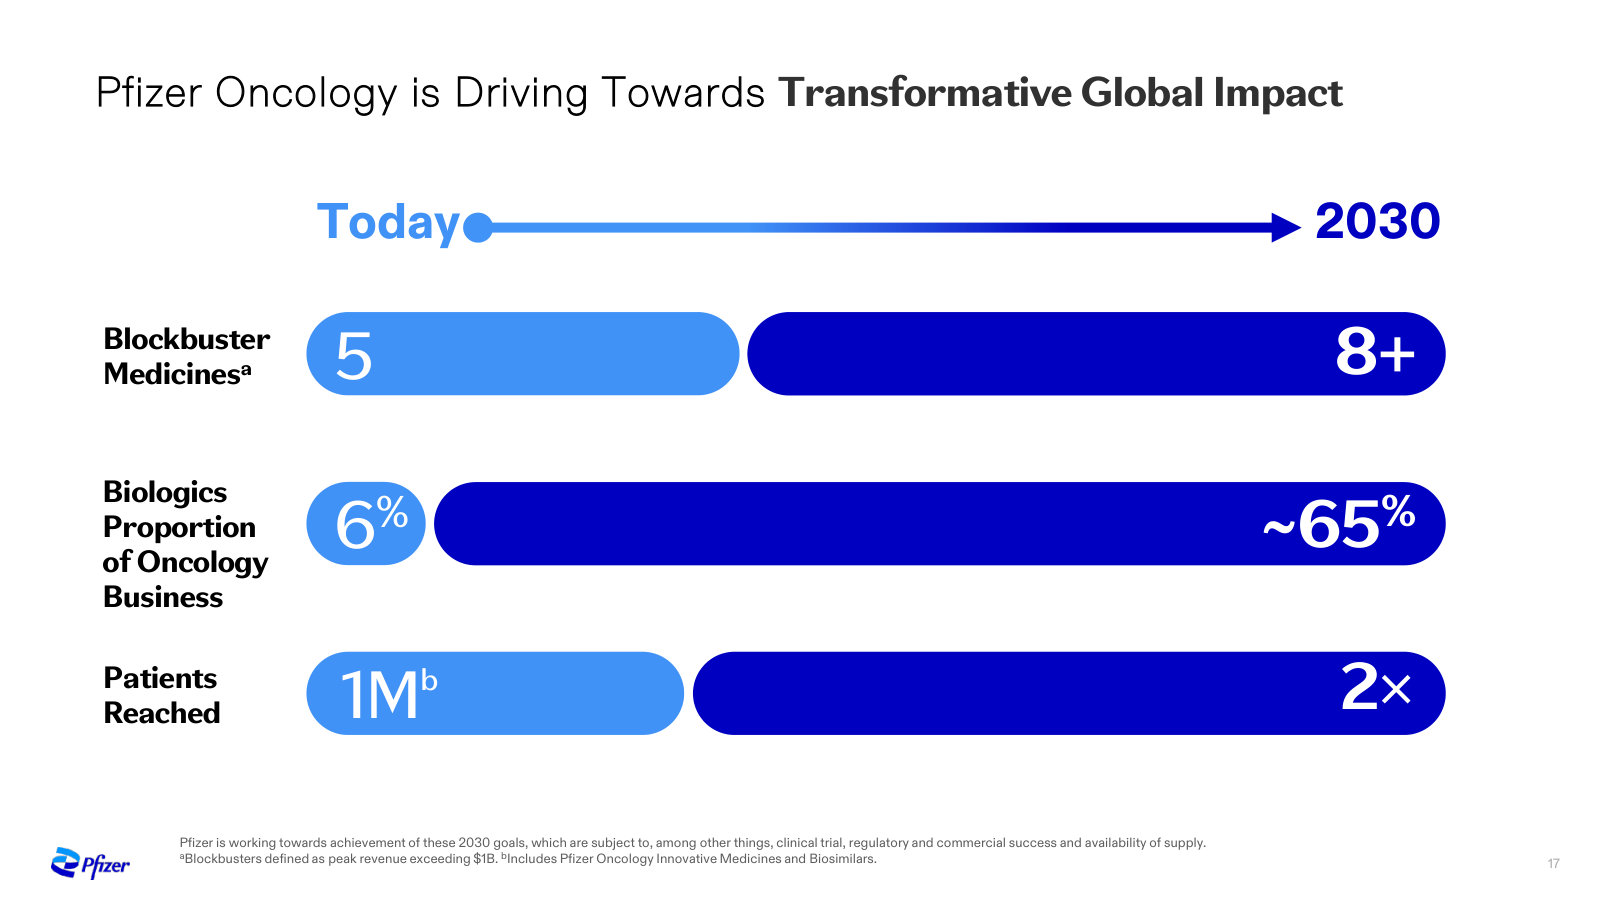
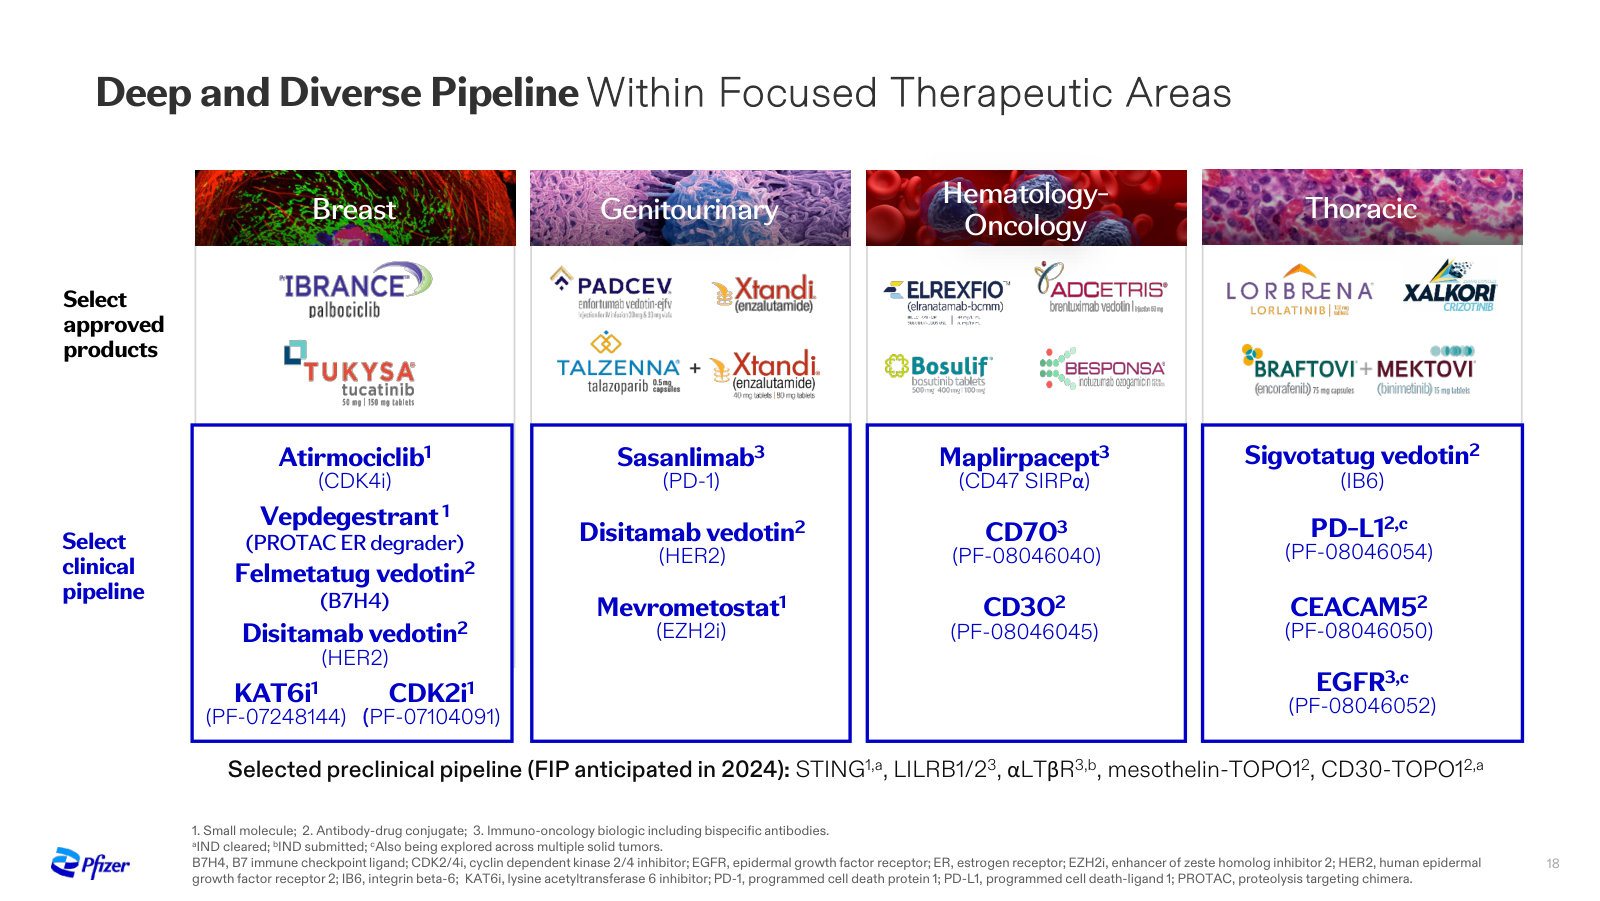
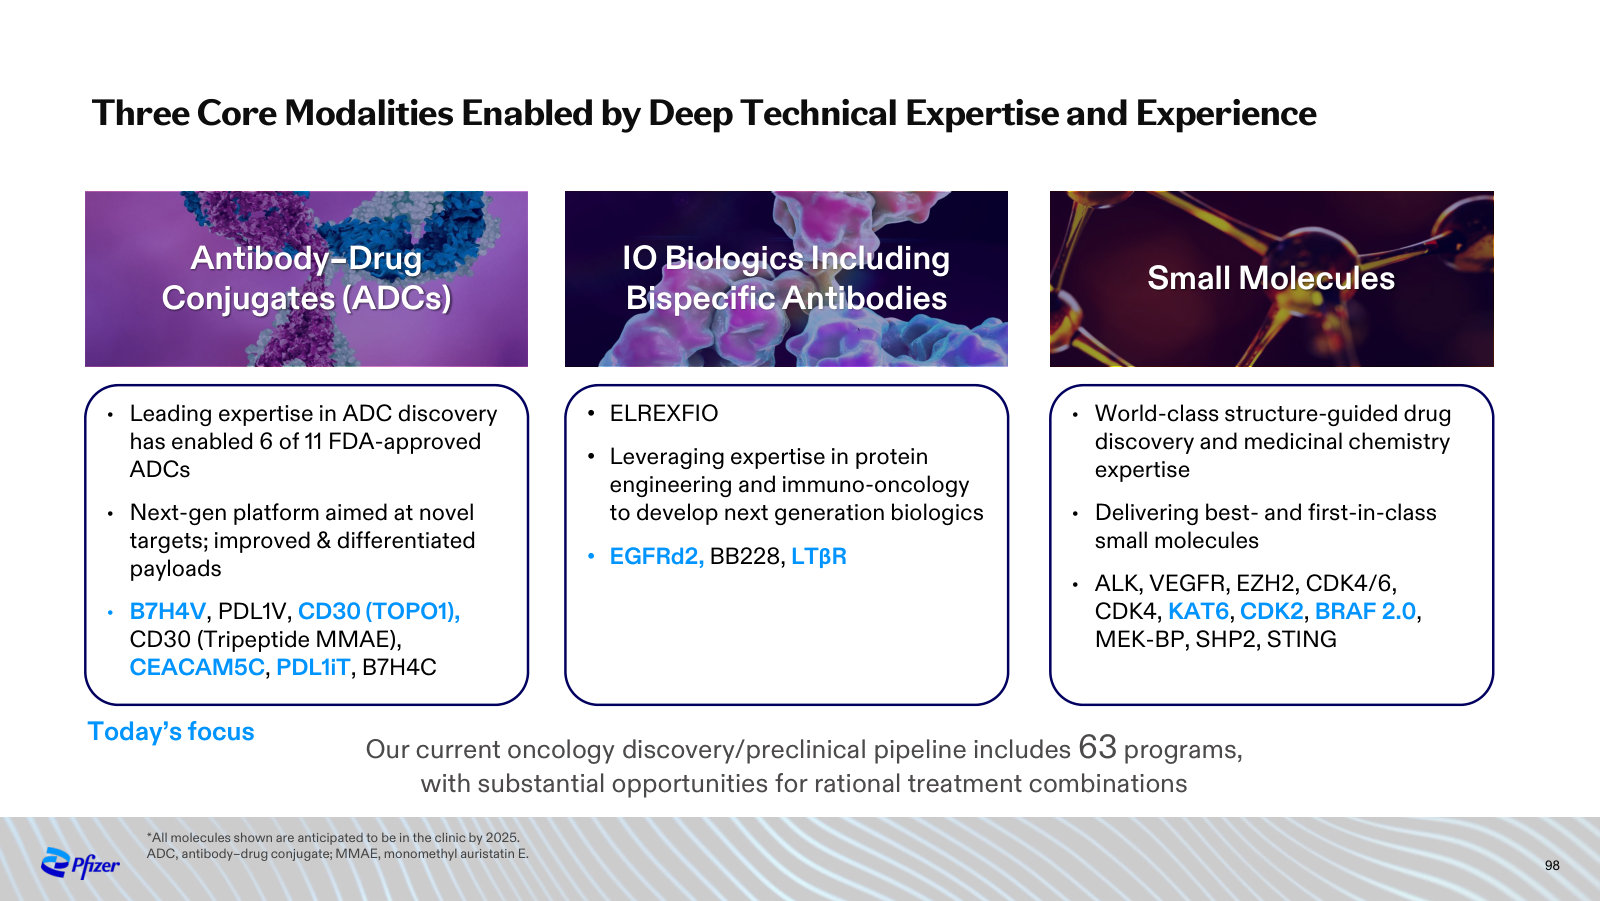
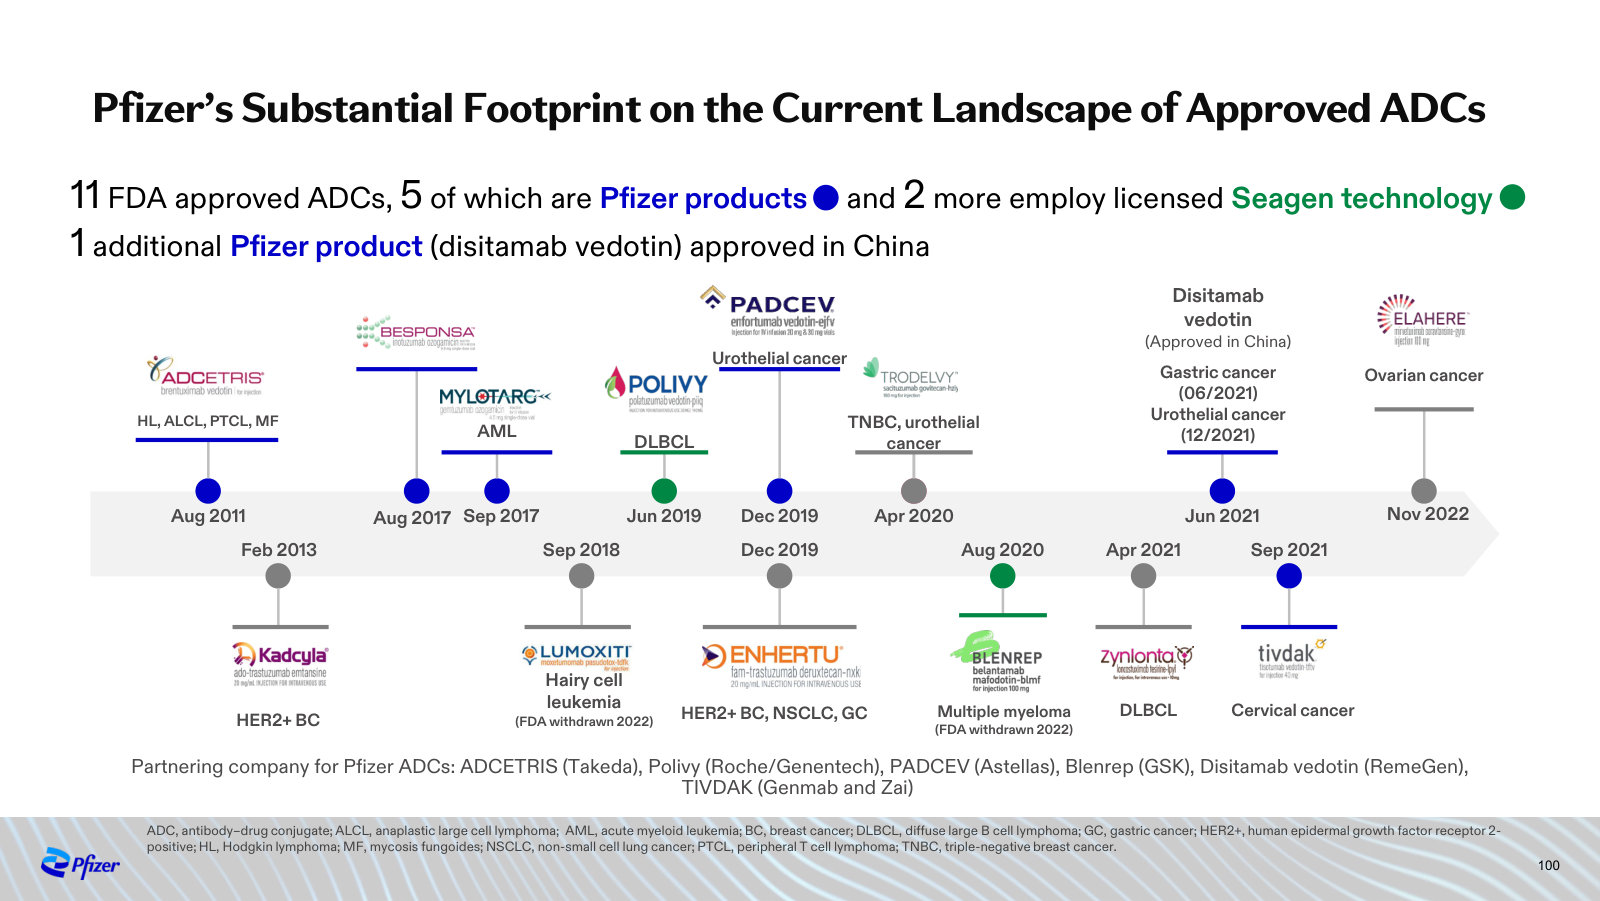
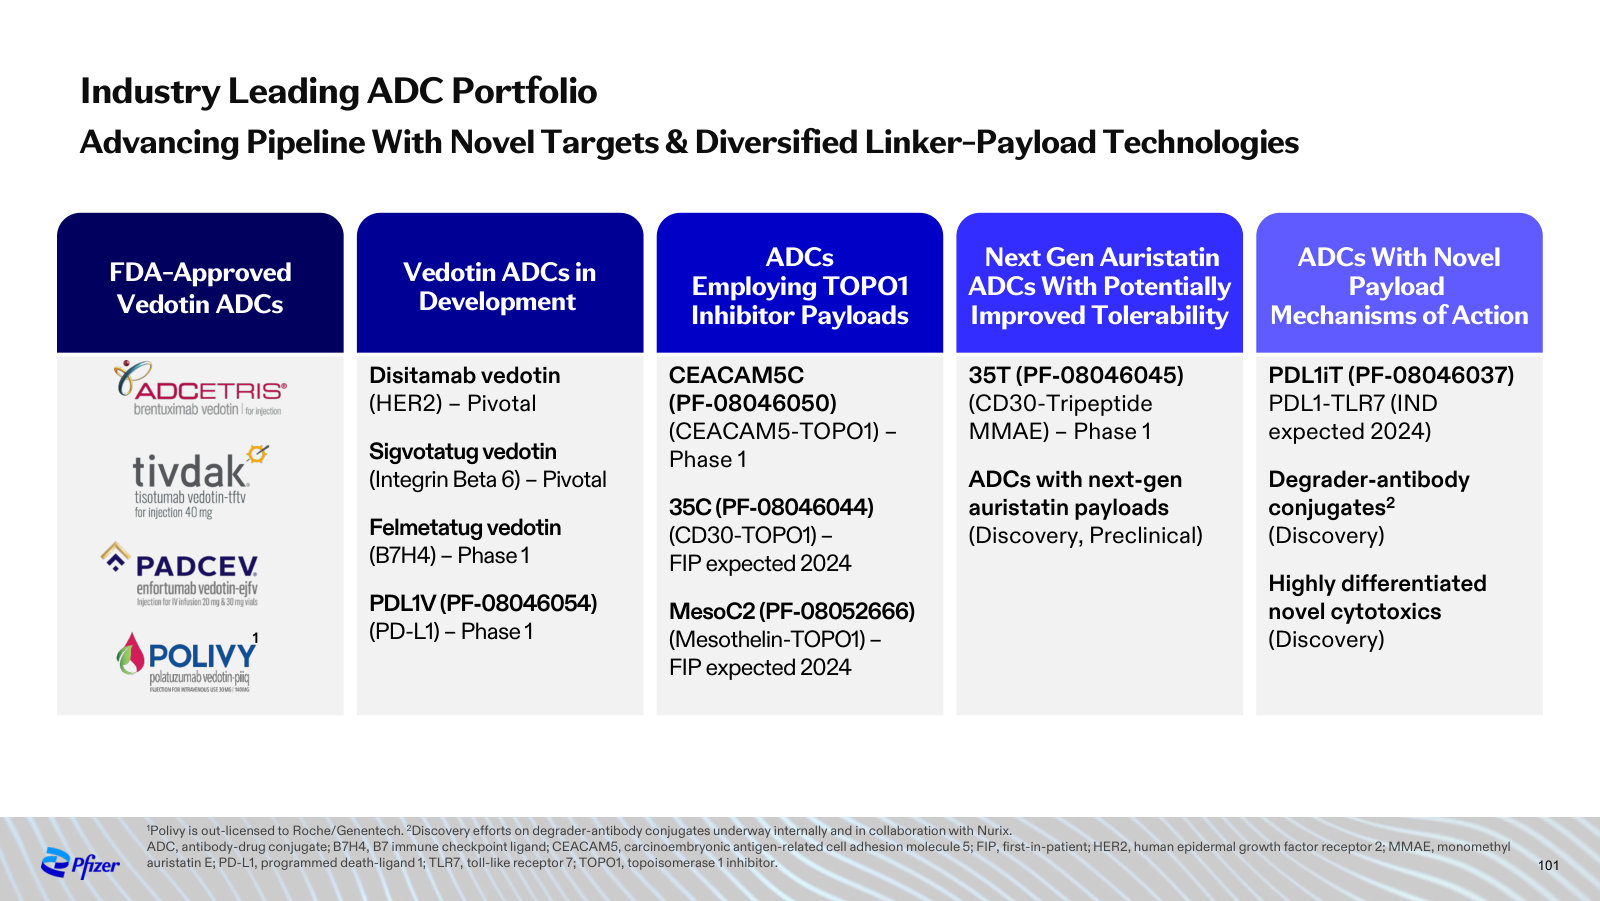
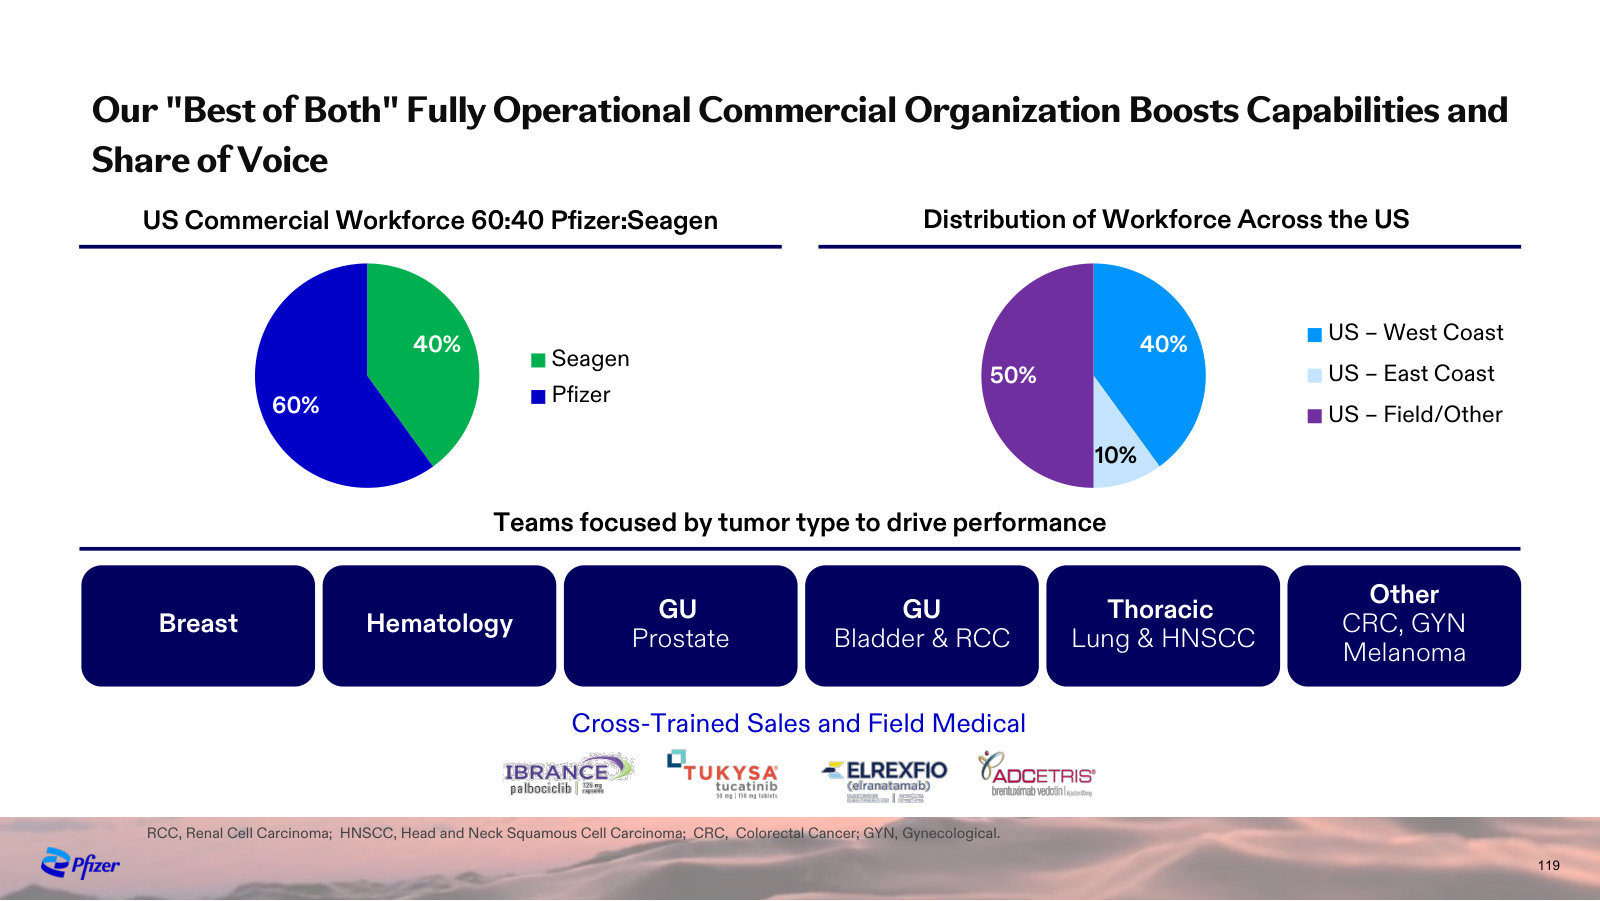
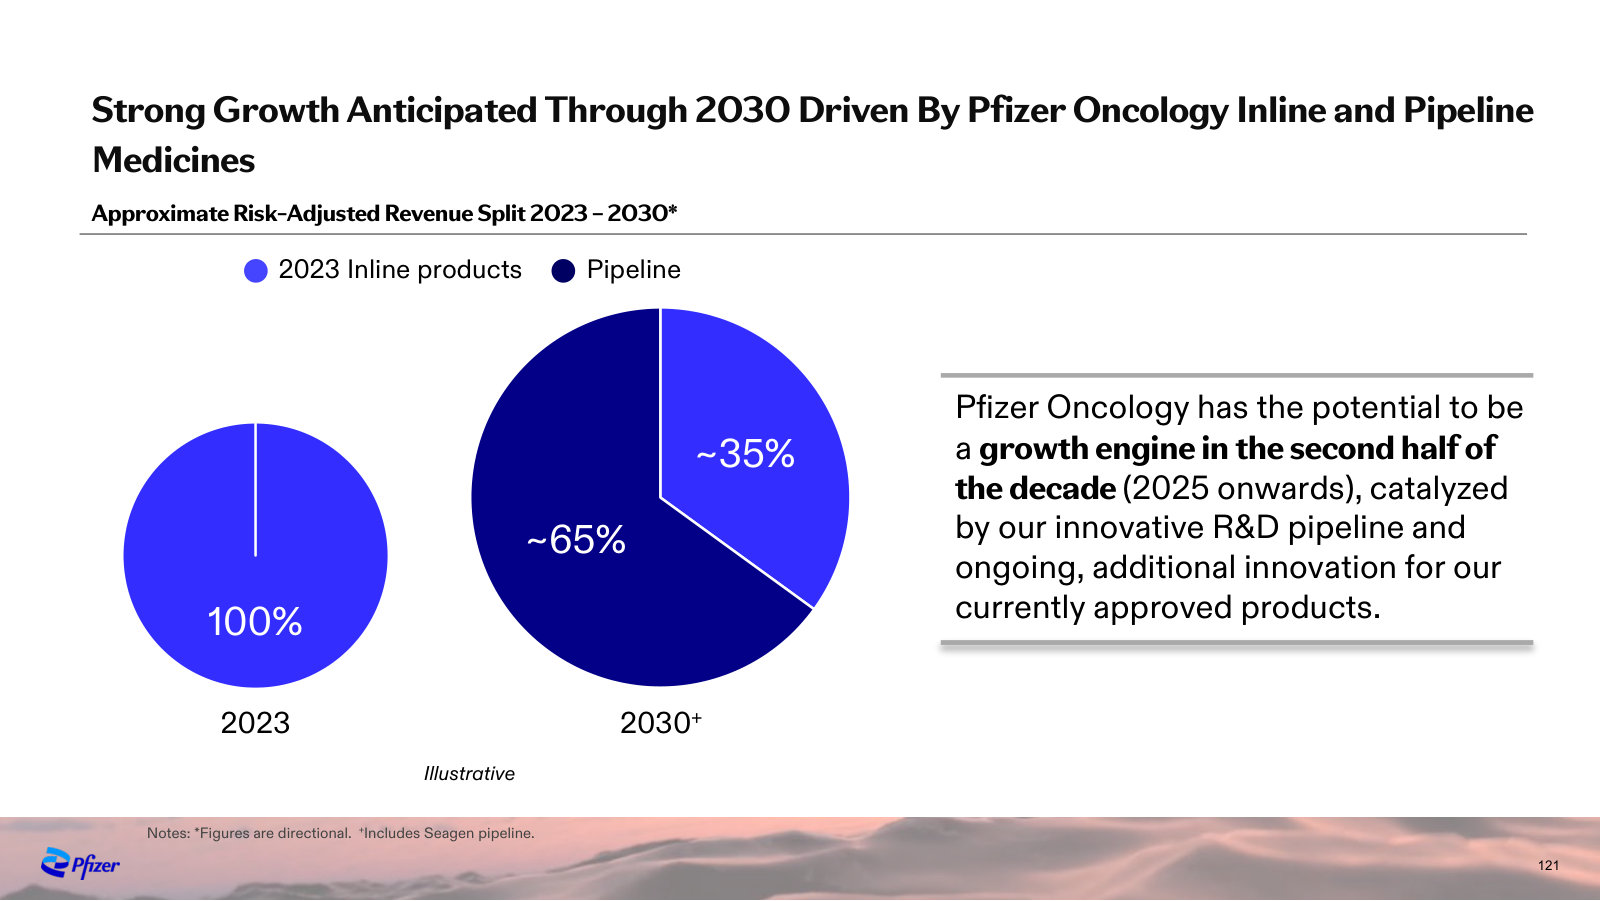
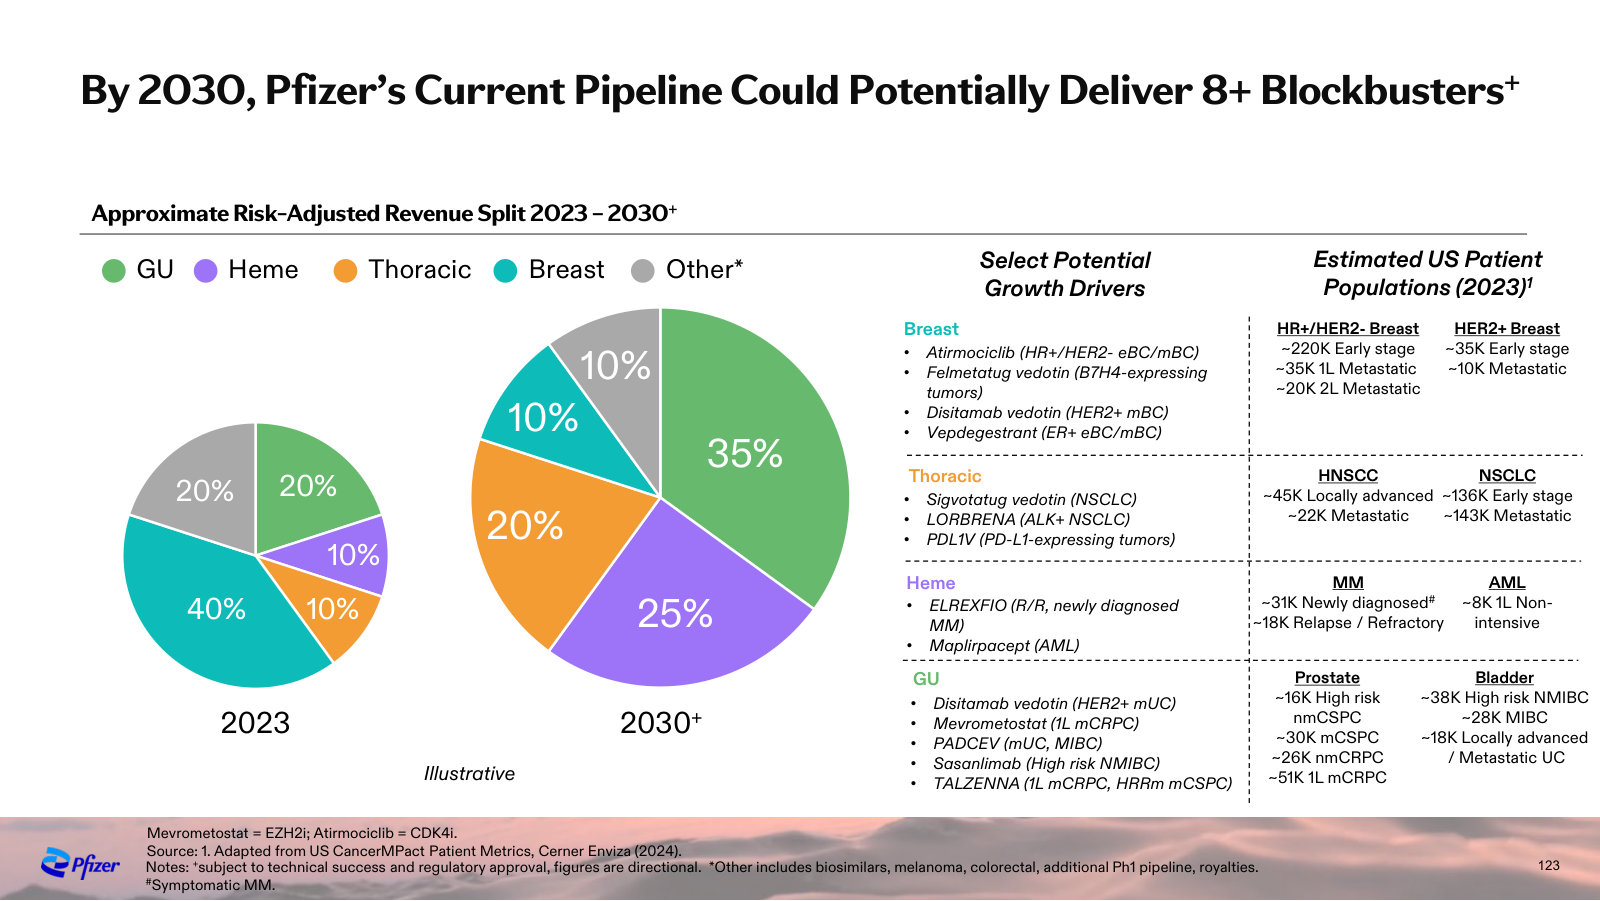
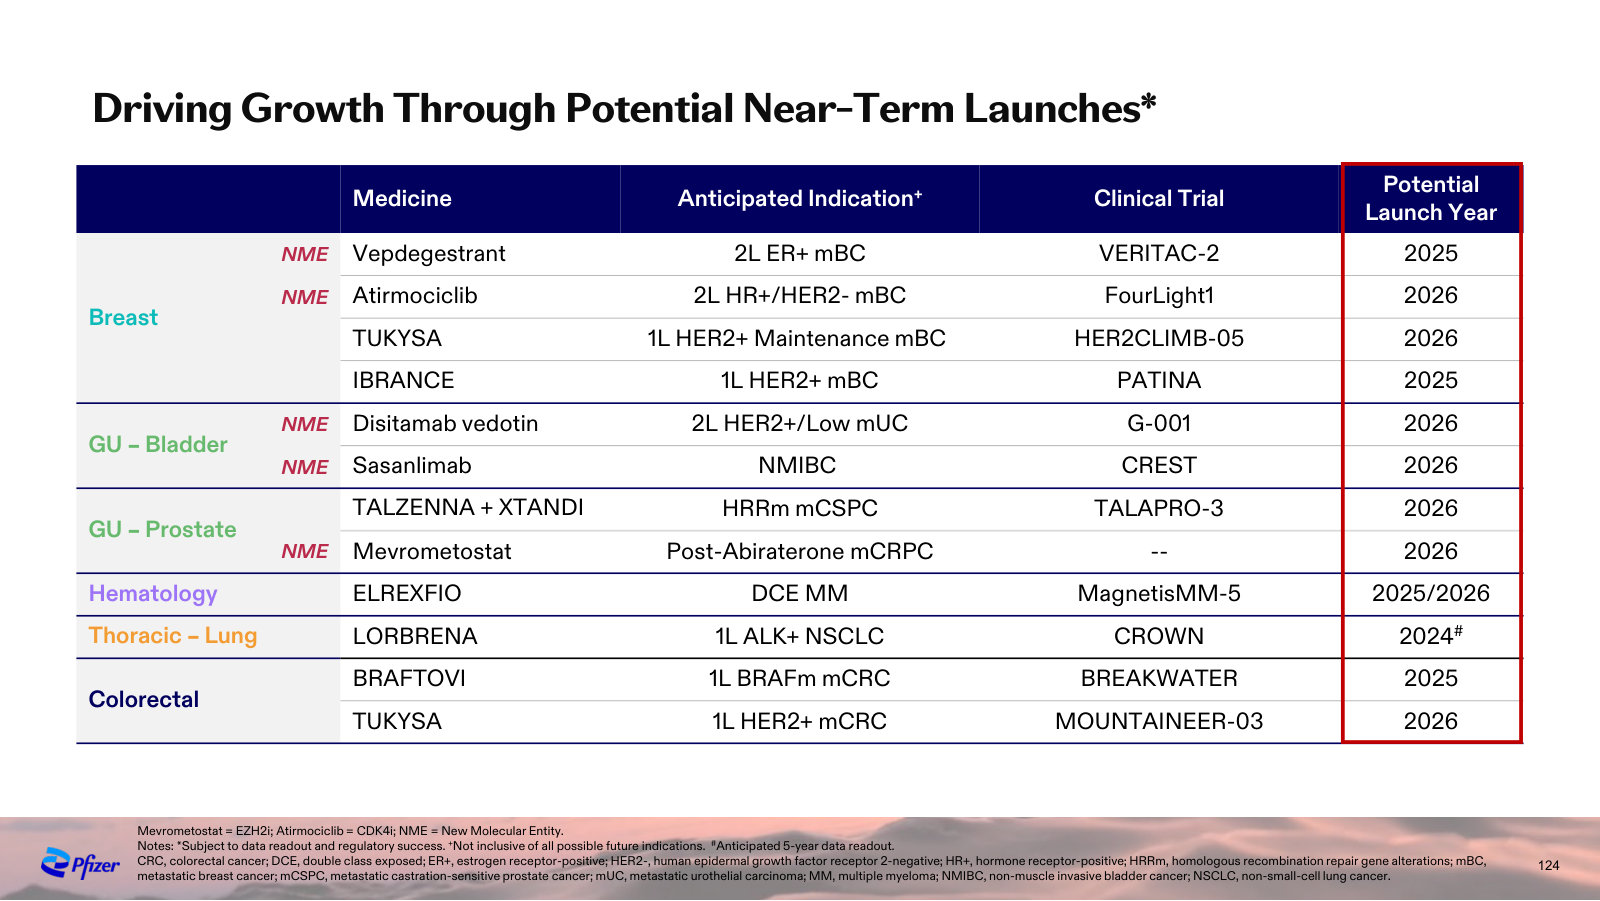
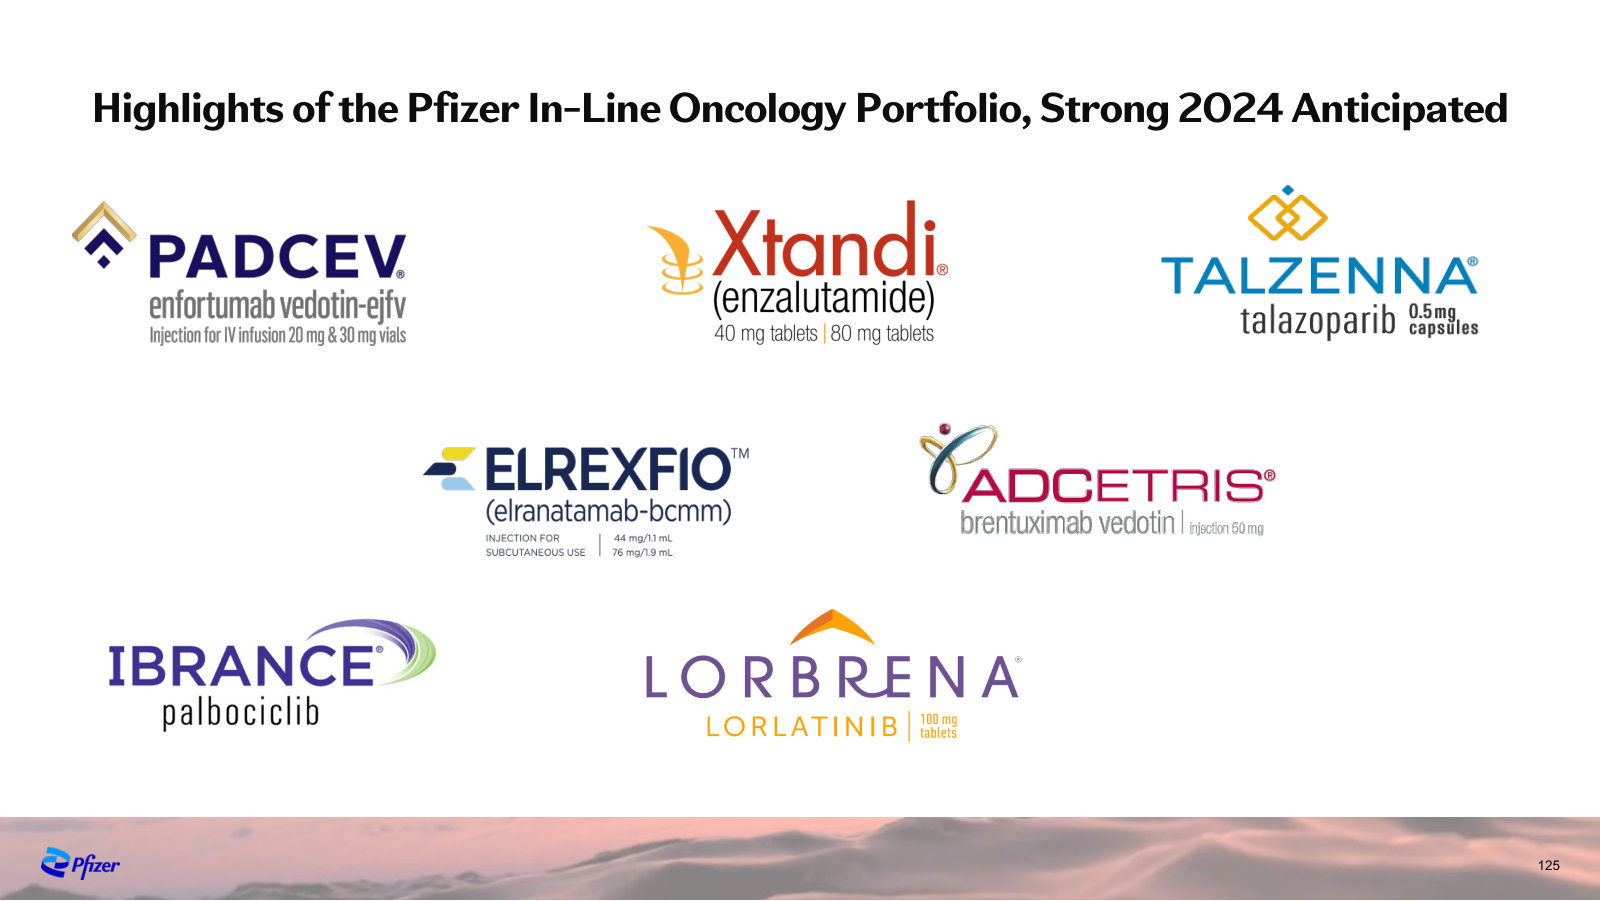
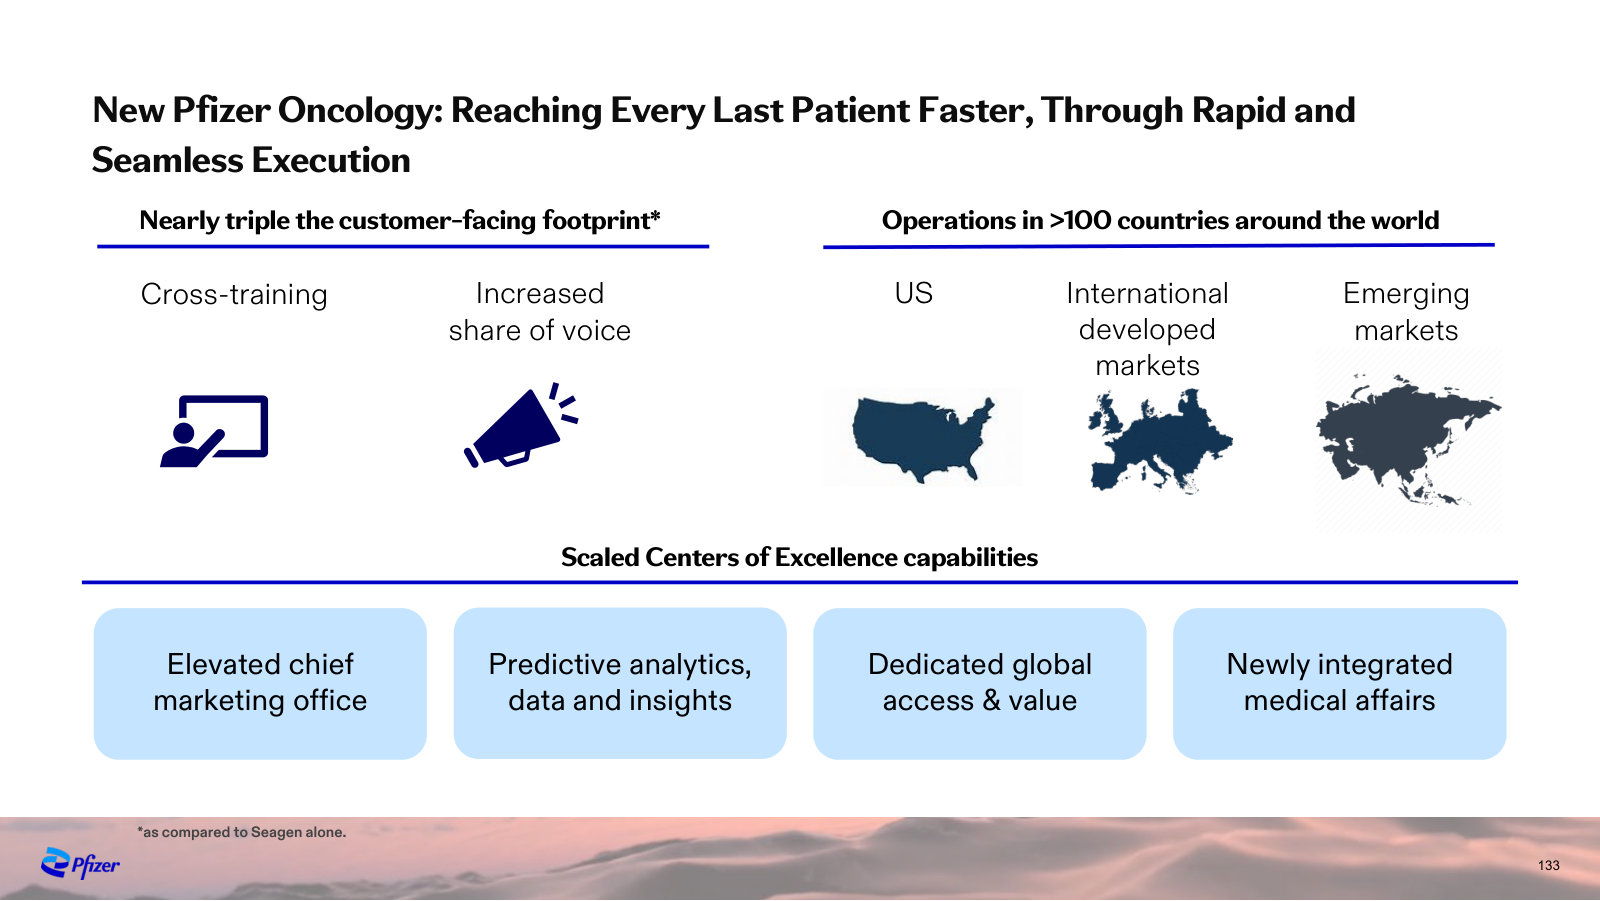
p. 8 — The market being addressed — roughly 2M new US cancer cases a year and 10M cancer deaths globally. · Open the full presentation →p. 9 — The thesis in one image: Pfizer's scale plus Seagen's ADC pioneering, combined into one oncology business. · Open the full presentation →p. 11 — A decade built portfolio by portfolio — 19% oncology revenue CAGR versus 10% for the industry, aiming to double patients by 2030. · Open the full presentation →p. 13 — How fast Pfizer moves molecules to approval, shown across a small molecule, a bispecific and an ADC. · Open the full presentation →p. 14 — The manufacturing behind it — 10 oncology sites on three continents and a 6x jump in ADC capacity from Seagen. · Open the full presentation →p. 16 — The strategy on a page: three modalities (small molecules, ADCs, bispecifics) across four tumor areas. · Open the full presentation →p. 17 — The 2030 ambition quantified — 5 to 8+ blockbusters, and biologics from 6% to ~65% of the oncology business. · Open the full presentation →p. 18 — The portfolio and pipeline mapped across breast, genitourinary, hematology and thoracic cancers. · Open the full presentation →p. 98 — The three-modality R&D platform, and the 63-program discovery pipeline underneath it. · Open the full presentation →p. 100 — Pfizer's place in the ADC market — 5 of 11 FDA-approved conjugates, plus two more on licensed Seagen technology. · Open the full presentation →p. 101 — The ADC pipeline organized by linker-payload technology, from approved vedotins to novel-payload programs. · Open the full presentation →p. 119 — How the commercial organization is built — a 60:40 Pfizer:Seagen workforce structured into tumor-type teams. · Open the full presentation →p. 121 — Where growth comes from — pipeline expected to supply ~65% of oncology revenue by 2030 versus none today. · Open the full presentation →p. 123 — The 8+ blockbuster case broken out by tumor area, with the drivers and US patient populations behind each. · Open the full presentation →p. 124 — The near-term launch calendar — medicine, indication, trial and expected launch year through 2026. · Open the full presentation →p. 125 — The in-line oncology portfolio at a glance — the seven marketed brands carrying revenue today. · Open the full presentation →p. 133 — The go-to-market reach — US, developed and emerging markets across 100+ countries, with scaled central capabilities. · Open the full presentation →
First Quarter 2026 Earnings — Q1 2026 · 25 pages · The latest quarterly print — how the year is tracking against the 2026 guidance in the featured deck. · Open →
Investor Overview — 2026 J.P. Morgan Healthcare Conference — 2026 · 8 pages · An 8-page standalone overview of 2026 guidance, the margin plan and pipeline catalysts, if you want the short version. · Open →
Fourth Quarter 2024 Earnings — Q4 / FY 2024 · 24 pages · The FY2024 baseline these 2025 results are measured against. · Open →
Investor Overview — 2025 J.P. Morgan Healthcare Conference — 2025 · 11 pages · The prior-year J.P. Morgan overview, for comparison with the 2026 edition. · Open →