Full Report
The numbers behind Pfizer Inc.: as-reported financial statements and company metrics for FY2021–FY2025, traced to the source filings, opened with the share-price history those statements have to justify. Every linked figure opens the exact page of the filing it was printed on, with the statement row highlighted. Amounts in US$ millions unless noted.
Reading notes: Display units: US$ millions, except per-share (US$) and share counts (millions), as printed on the consolidated statements. Fiscal year ends December 31. Revenue components: FY2021–FY2022 are shown as reported in the FY2023 10-K, which lined only Product and Alliance revenues (royalty income was not separately presented), so the Royalty revenues row is blank for those years. FY2023–FY2025 include the separate Royalty revenues line introduced in the FY2024 10-K; on that basis Total revenues were recast upward by the royalty amount (FY2023: $58,496M - $59,553M). Revenue by Therapeutic Area: FY2023–FY2025 come from the FY2025 10-K (Note 17, recast basis); FY2021–FY2022 come from the FY2023 10-K (original basis). Because of the FY2023 recast, the FY2023 category figures shown here (e.g., Primary Care $30,799M) differ slightly from the FY2023 10-K's original presentation ($30,589M). Pfizer Ignite is being wound down (discontinued in 2025). Balance sheet prints two years per 10-K: FY2021 is sourced from the FY2022 10-K, FY2022–FY2023 from the FY2023 10-K, FY2024–FY2025 from the FY2025 10-K. 'Trade accounts receivable, net' and 'Property, plant and equipment' / 'Identifiable intangible assets' appear with a '(net)' suffix in the FY2025 10-K and without it in earlier filings; labels are harmonized here.
Share Price — Full Available History — 37 Years
The stock closed at $24.64 on Jul 24, 2026 — up 22,160% over the window shown (+15.9% a year), trading between $0.09 and $61.25. At that close the stock trades at 18× FY2025 diluted EPS as reported below.
Source: market price feed, monthly closes, sampled from 9,208 source observations, Jan 1990–Jul 2026. Price return only, excludes dividends. Prices are split-adjusted (1:2 on Apr 01, 1991; 1:2 on Jul 03, 1995; 1:2 on Jul 01, 1997; 1:3 on Jul 01, 1999; ×1.054 on Nov 17, 2020).
Market capitalization $151.8bn and enterprise value $215.3bn.
Market cap = 6.16B shares outstanding × the Jul 24, 2026 close of $24.64. Enterprise value adds total debt of $64.6bn and subtracts cash and equivalents of $1.1bn (net debt of $63.5bn), from the FY2025 balance sheet. Market-derived figures, shown without filing links.
FY2025 at a Glance
Revenue (US$ millions)
Net income (US$ millions)
Diluted EPS
Source: FY2025 consolidated statements [1] [2]. Click any linked figure to open the filing page with the row highlighted.
Revenue by Therapeutic Area
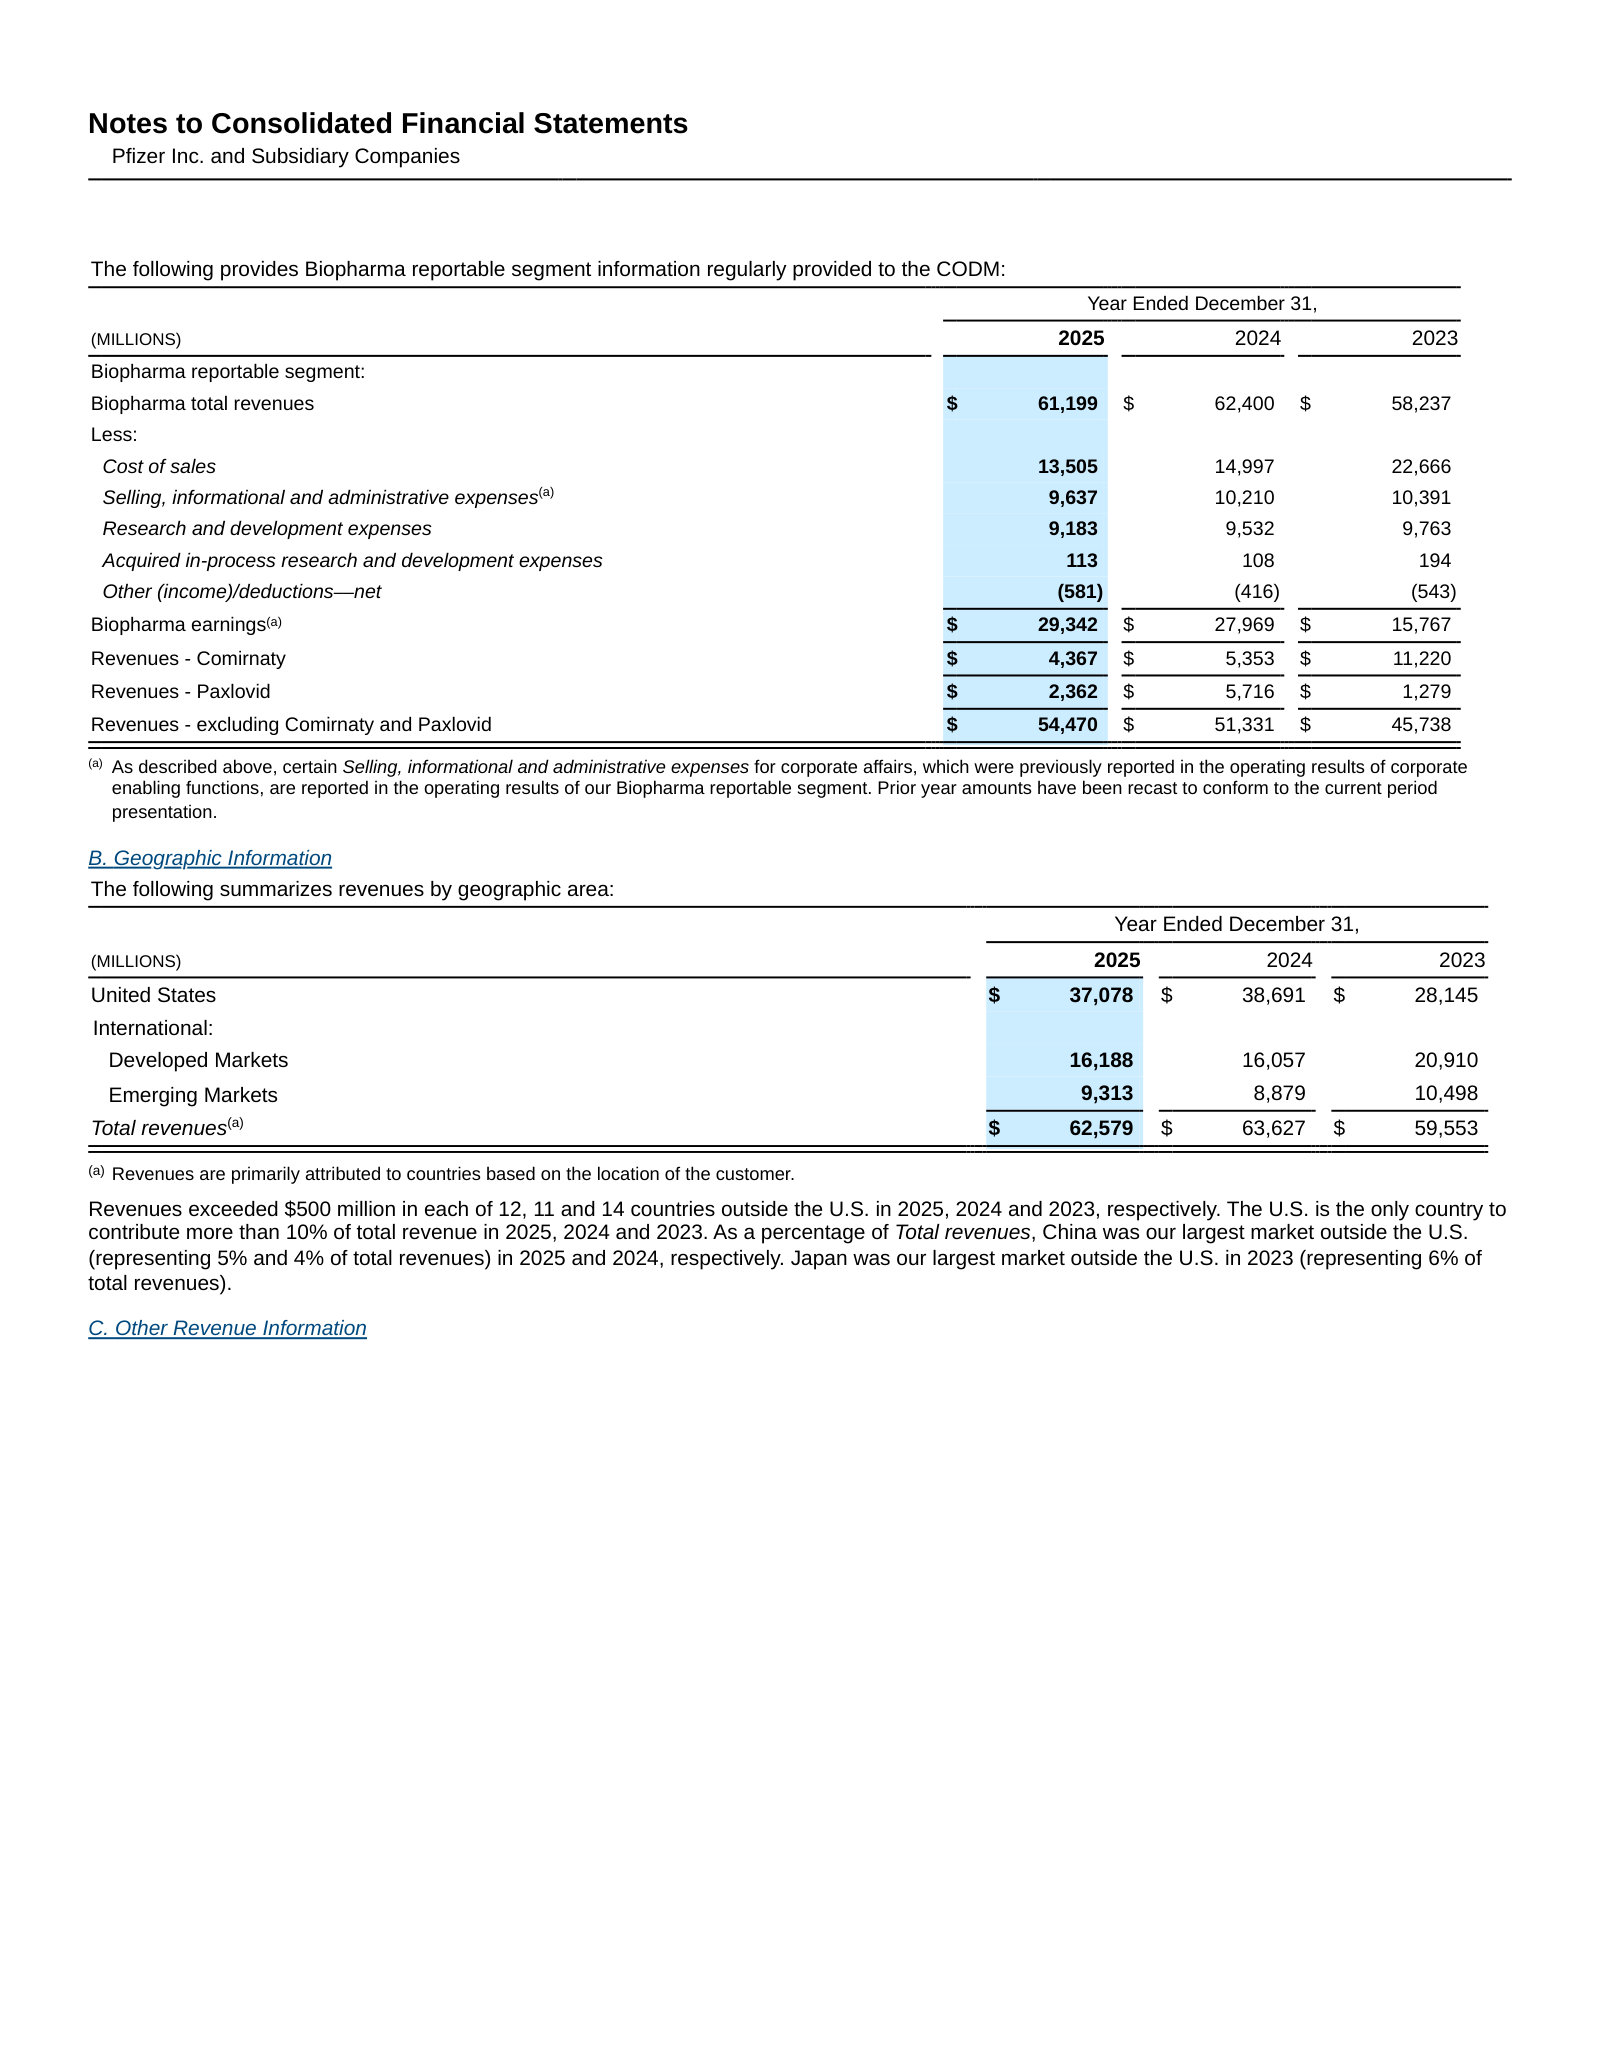
| Revenue by Therapeutic Area | FY2021 | FY2022 | FY2023 | FY2024 | FY2025 |
|---|---|---|---|---|---|
| Primary Care | 52,029 | 73,023 | 30,799 | 30,135 | 26,820 |
| Specialty Care | 15,194 | 13,833 | 14,988 | 16,652 | 17,546 |
| Oncology | 12,333 | 12,132 | 12,450 | 15,612 | 16,834 |
| Biopharma | 79,557 | 98,988 | 58,237 | 62,400 | 61,199 |
| Pfizer CentreOne | 1,731 | 1,335 | 1,272 | 1,146 | 1,338 |
| Pfizer Ignite | 0 | 7 | 44 | 82 | 41 |
| Total revenues | 81,288 | 100,330 | 59,553 | 63,627 | 62,579 |
| Total revenues growth, derived | — | +23.4% | -40.6% | +6.8% | -1.6% |
Source: Note 17 Segment, Geographic and Other Revenue Information — Significant Revenues by Product [3] [4] [5]. Click any linked figure to open the filing page with the row highlighted.
Income Statement
Source: Consolidated Statements of Operations [1] [2]. Click any linked figure to open the filing page with the row highlighted.
Columns marked E are consensus analyst estimates from S&P Capital IQ (CapIQ), shown alongside reported results for direct comparison; they are not company guidance.
Estimate source: S&P Capital IQ (CapIQ) consensus, as of 2026-07-27. Estimate figures are S&P Capital IQ consensus (vendor data — no filing page links). EPS and net income use the normalized (adjusted) consensus where the street reports it. Line-item analyst models (segments, drivers, KPIs) are in the Visible Alpha tab.
Balance Sheet
Source: Consolidated Balance Sheets [6] [7] [8]. Click any linked figure to open the filing page with the row highlighted.
Cash Flow
Source: Consolidated Statements of Cash Flows [9] [10]. Click any linked figure to open the filing page with the row highlighted.
Blockbuster Franchises — Significant Revenues by Product
| Blockbuster Franchises — Significant Revenues by Product | FY2021 | FY2022 | FY2023 | FY2024 | FY2025 |
|---|---|---|---|---|---|
| Comirnaty (COVID-19 vaccine) | 36,781 | 37,806 | 11,220 | 5,353 | 4,367 |
| Paxlovid | 76 | 18,933 | 1,279 | 5,716 | 2,362 |
| Eliquis | 5,970 | 6,480 | 6,747 | 7,366 | 7,961 |
| Prevnar family | 5,272 | 6,337 | 6,501 | 6,411 | 6,494 |
| Vyndaqel family | 2,015 | 2,447 | 3,321 | 5,451 | 6,380 |
| Ibrance | 5,437 | 5,120 | 4,753 | 4,367 | 4,122 |
Source: company filings [3] [5]. Click any linked figure to open the filing page with the row highlighted.
Growth Drivers Oncology — Product Revenues
| Growth Drivers Oncology — Product Revenues | FY2021 | FY2022 | FY2023 | FY2024 | FY2025 |
|---|---|---|---|---|---|
| Nurtec ODT/Vydura | — | 213 | 928 | 1,263 | 1,424 |
| Abrysvo (RSV vaccine) | — | — | 890 | 755 | 1,033 |
| Padcev | — | — | 53 | 1,588 | 1,940 |
| Xtandi | — | — | 1,659 | 2,039 | 2,194 |
| Xeljanz | 2,455 | 1,796 | 1,703 | 1,168 | 1,087 |
| Lorbrena | 266 | 343 | 539 | 731 | 1,023 |
Source: company filings [3] [5]. Click any linked figure to open the filing page with the row highlighted.
Revenue by Geography
| Revenue by Geography | FY2021 | FY2022 | FY2023 | FY2024 | FY2025 |
|---|---|---|---|---|---|
| United States revenue | 29,746 | 42,473 | 28,145 | 38,691 | 37,078 |
| Emerging Markets revenue | 20,701 | 20,097 | 10,498 | 8,879 | 9,313 |
| Developed Markets revenue | — | — | 20,910 | 16,057 | 16,188 |
Source: company filings [11] [12]. Click any linked figure to open the filing page with the row highlighted.
Non-GAAP Profitability, Capital Returns Workforce
| Non-GAAP Profitability, Capital Returns Workforce | FY2021 | FY2022 | FY2023 | FY2024 | FY2025 |
|---|---|---|---|---|---|
| Adjusted diluted EPS (non-GAAP) | 4.06 | 6.58 | 1.84 | 3.11 | 3.22 |
| Adjusted income (non-GAAP) | 23,196 | 37,717 | 10,501 | 17,716 | 18,406 |
| Adjusted effective tax rate (non-GAAP) | 14.5% | 11.7% | 9.0% | 14.5% | 12.7% |
| Cash dividends declared per share | 1.57 | 1.61 | 1.65 | 1.69 | 1.72 |
| Employees (worldwide, year-end) | 79,000 | 83,000 | 88,000 | 81,000 | 75,000 |
Source: company filings [13] [14] [15] [16]. Click any linked figure to open the filing page with the row highlighted.
Long-Term Record
| Fiscal year | Total revenue | Net income | Diluted EPS | Operating cash flow | Capital expenditures |
|---|---|---|---|---|---|
| FY2019 | 40,905 | 16,026 | 2.82 | 12,588 | 2,046 |
| FY2020 | 41,651 | 9,159 | 1.63 | 14,403 | 2,226 |
| FY2021 | 81,288 | 21,979 | 3.85 | 32,580 | 2,711 |
| FY2022 | 100,330 | 31,372 | 5.47 | 29,267 | 3,236 |
| FY2023 | 59,553 | 2,119 | 0.37 | 8,700 | 3,907 |
| FY2024 | 63,627 | 8,031 | 1.41 | 12,744 | 2,909 |
| FY2025 | 62,579 | 7,771 | 1.36 | 11,704 | 2,629 |
Source: consolidated statements across filings; older years from the standardized feed [9] [1] [10] [2]. Click any linked figure to open the filing page with the row highlighted.
Analyst Consensus
Mean target
Median target
High target
Low target
Street ratings: 8 strong buy, 2 buy, 16 hold, 1 sell, 1 strong sell. Consensus: Buy.
Estimate source: S&P Capital IQ (CapIQ) consensus, as of 2026-07-27. Estimate figures are S&P Capital IQ consensus (vendor data — no filing page links). EPS and net income use the normalized (adjusted) consensus where the street reports it. Line-item analyst models (segments, drivers, KPIs) are in the Visible Alpha tab.
Traceability
399 of 399 figures on this page (100%) link to the filing page where they are printed — click a linked figure to open the source PDF at that page with the row highlighted. Unlinked figures come from standardized data feeds or pre-filing years.
Display units: US$ millions, except per-share (US$) and share counts (millions), as printed on the consolidated statements. Fiscal year ends December 31.
Revenue components: FY2021–FY2022 are shown as reported in the FY2023 10-K, which lined only Product and Alliance revenues (royalty income was not separately presented), so the Royalty revenues row is blank for those years. FY2023–FY2025 include the separate Royalty revenues line introduced in the FY2024 10-K; on that basis Total revenues were recast upward by the royalty amount (FY2023: $58,496M - $59,553M).
Revenue by Therapeutic Area: FY2023–FY2025 come from the FY2025 10-K (Note 17, recast basis); FY2021–FY2022 come from the FY2023 10-K (original basis). Because of the FY2023 recast, the FY2023 category figures shown here (e.g., Primary Care $30,799M) differ slightly from the FY2023 10-K's original presentation ($30,589M). Pfizer Ignite is being wound down (discontinued in 2025).
Balance sheet prints two years per 10-K: FY2021 is sourced from the FY2022 10-K, FY2022–FY2023 from the FY2023 10-K, FY2024–FY2025 from the FY2025 10-K. 'Trade accounts receivable, net' and 'Property, plant and equipment' / 'Identifiable intangible assets' appear with a '(net)' suffix in the FY2025 10-K and without it in earlier filings; labels are harmonized here.
Long-Term Record FY2019–FY2020 are the continuing-operations columns of the FY2021 10-K (after the 2019 Consumer Healthcare JV and the November 2020 Upjohn/Viatris separation) and are not comparable to Pfizer's originally reported pre-2019 totals. Capital expenditures are shown as positive magnitudes of the printed 'Purchases of property, plant and equipment' outflow.
6 figure(s) differed between the data feed and the filing; the filing value is shown (see the run's metrics/metrics_tab.json for the audit trail).
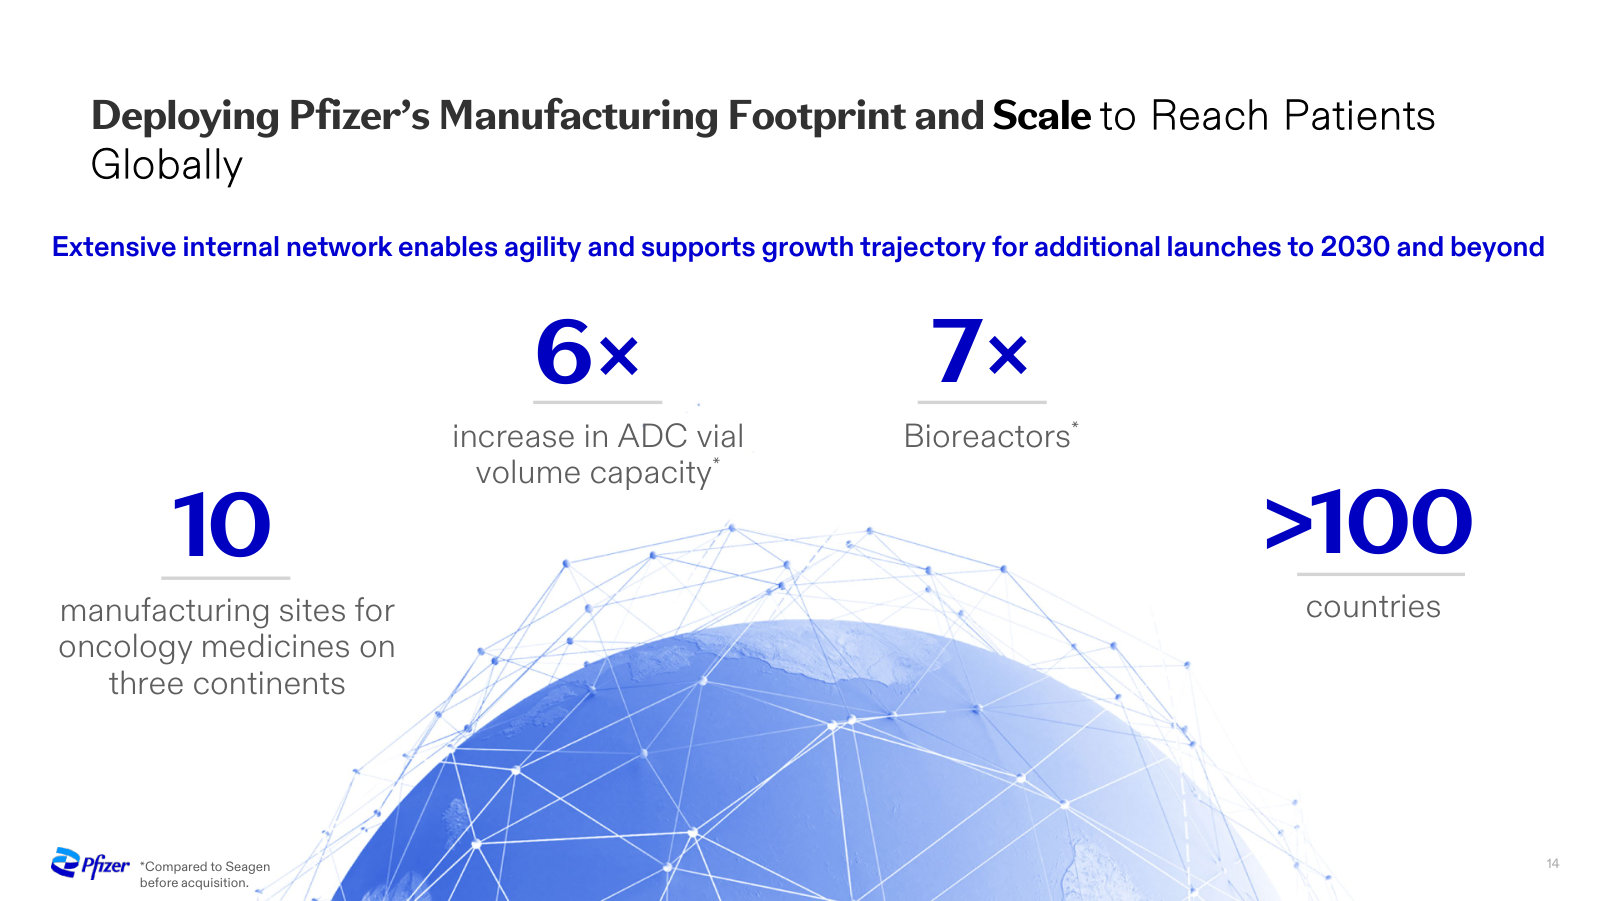
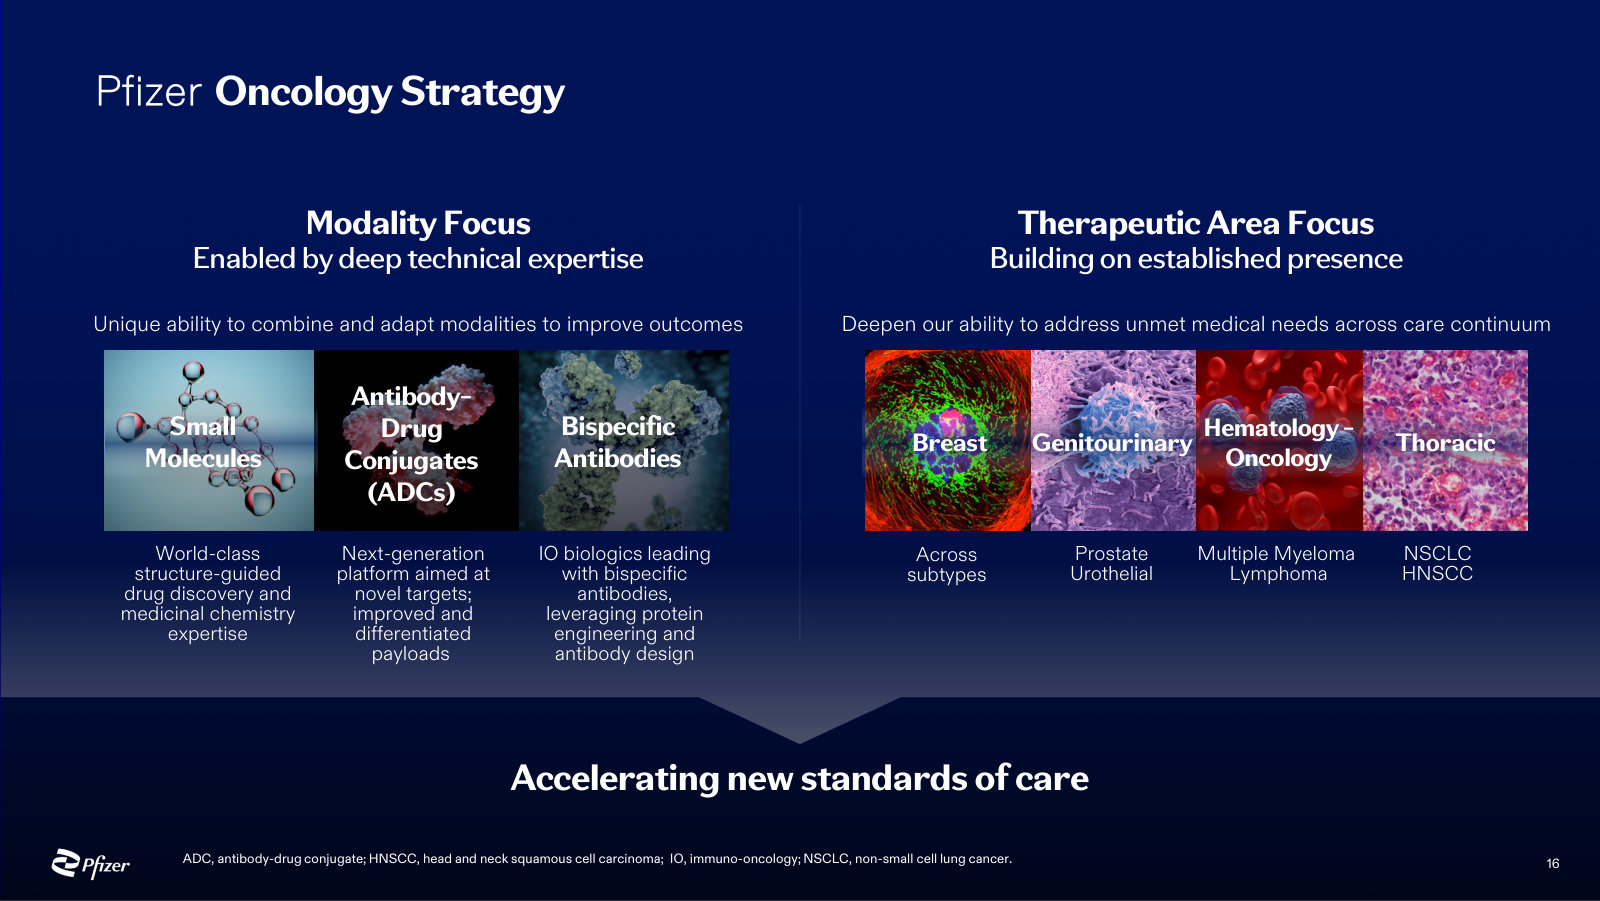
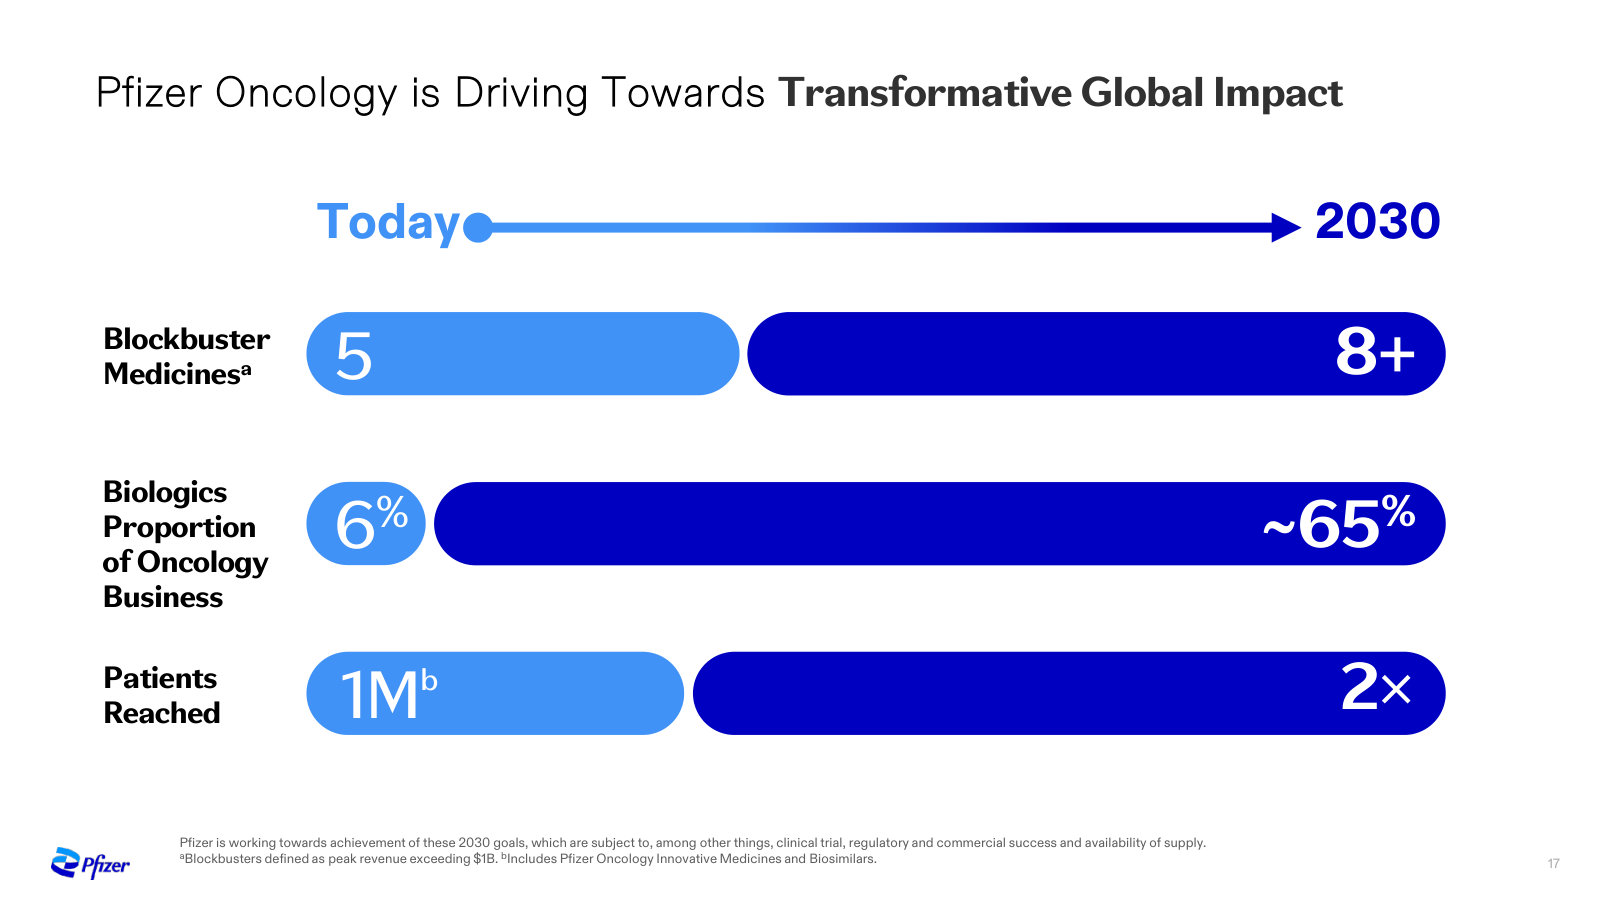
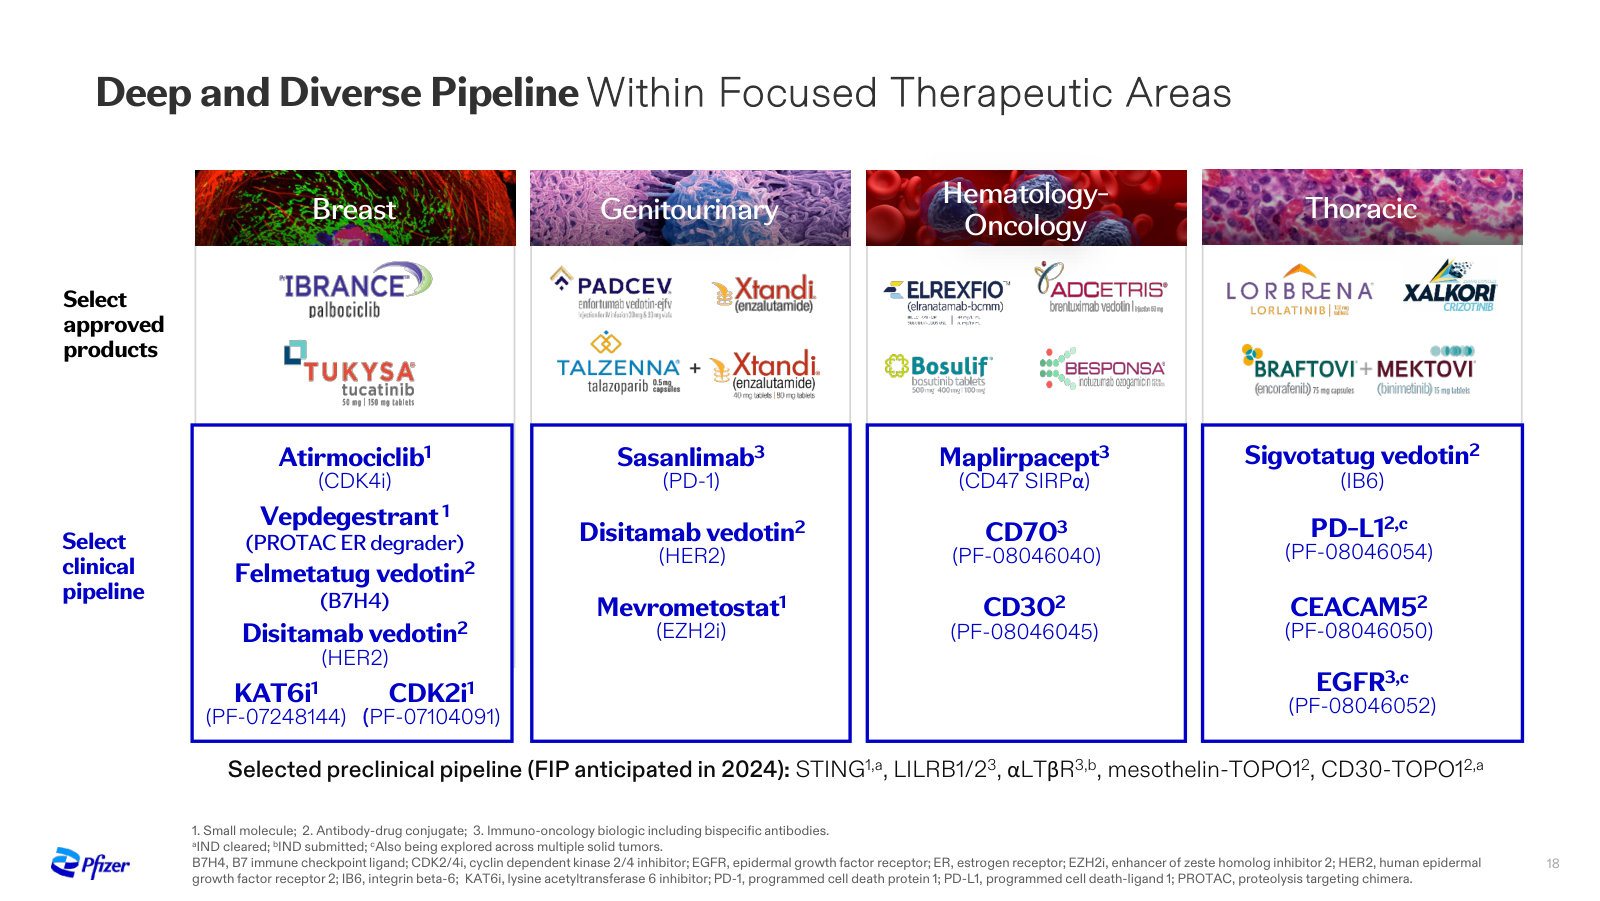
Pfizer Inc.'s management explains the business in its own materials. The slides below do the most of that work, pulled from the documents preserved in Sources. Each source link opens the complete presentation at that slide in a new tab.
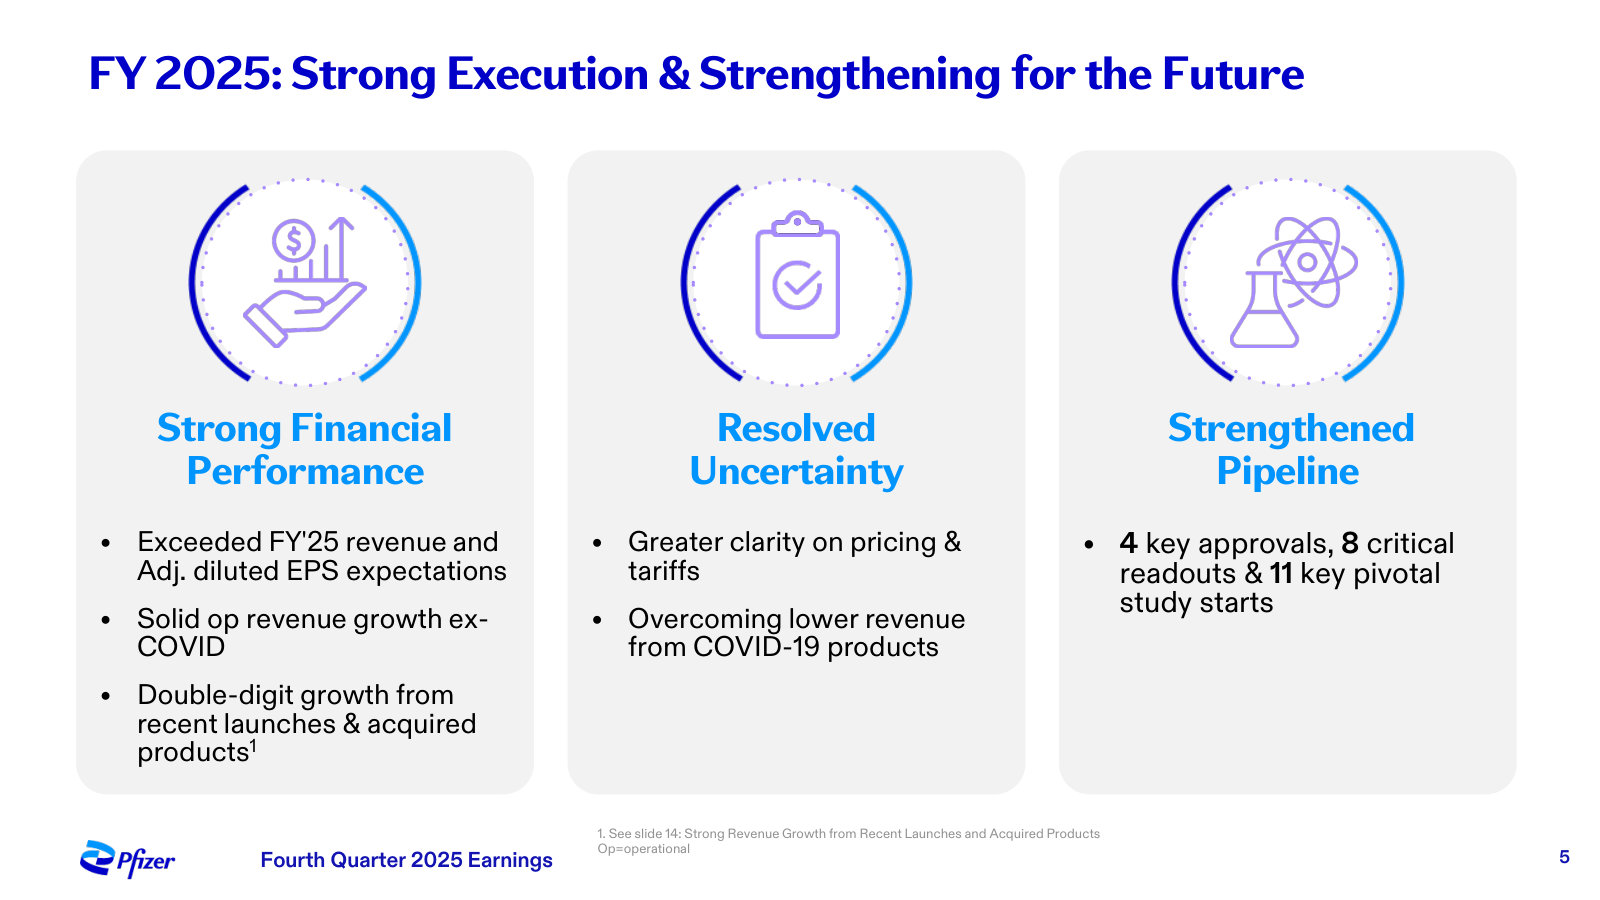
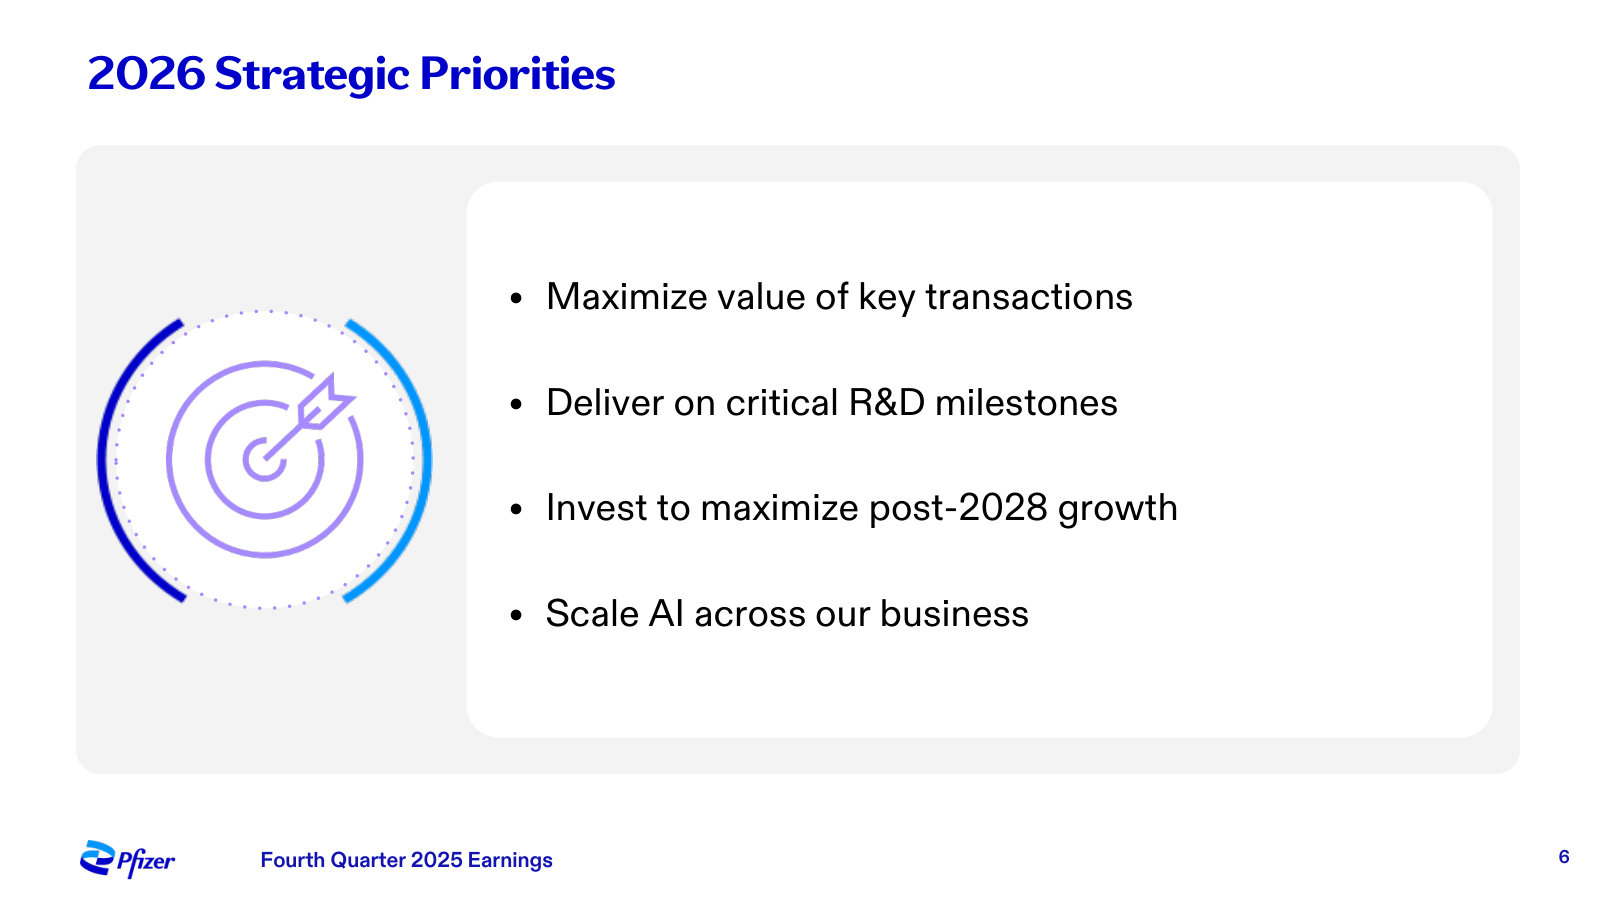
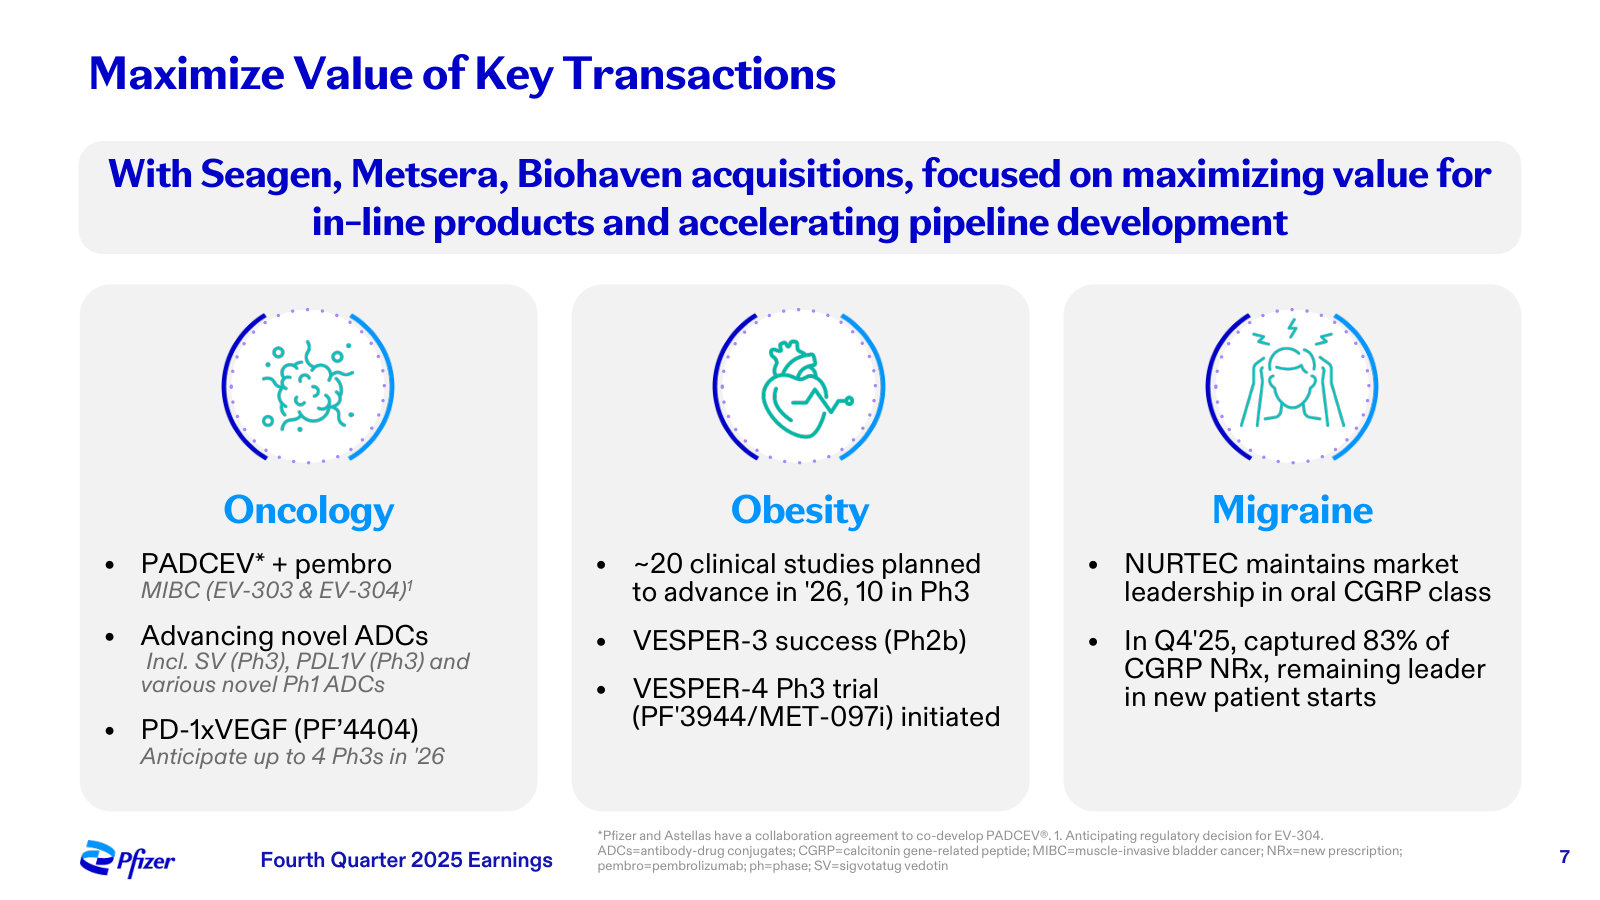
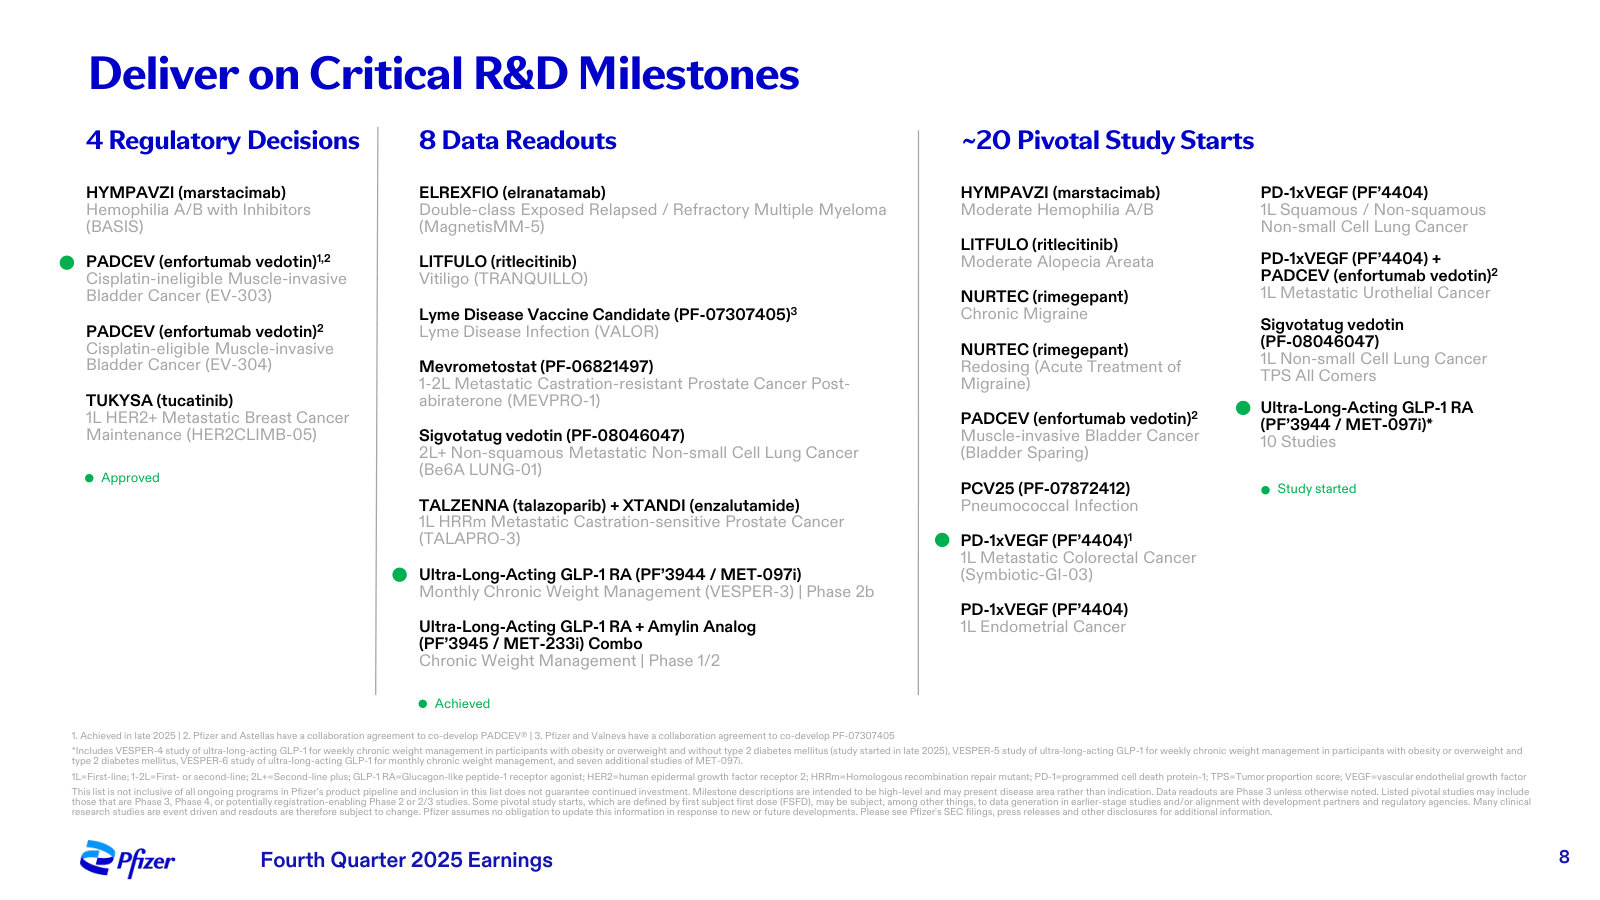
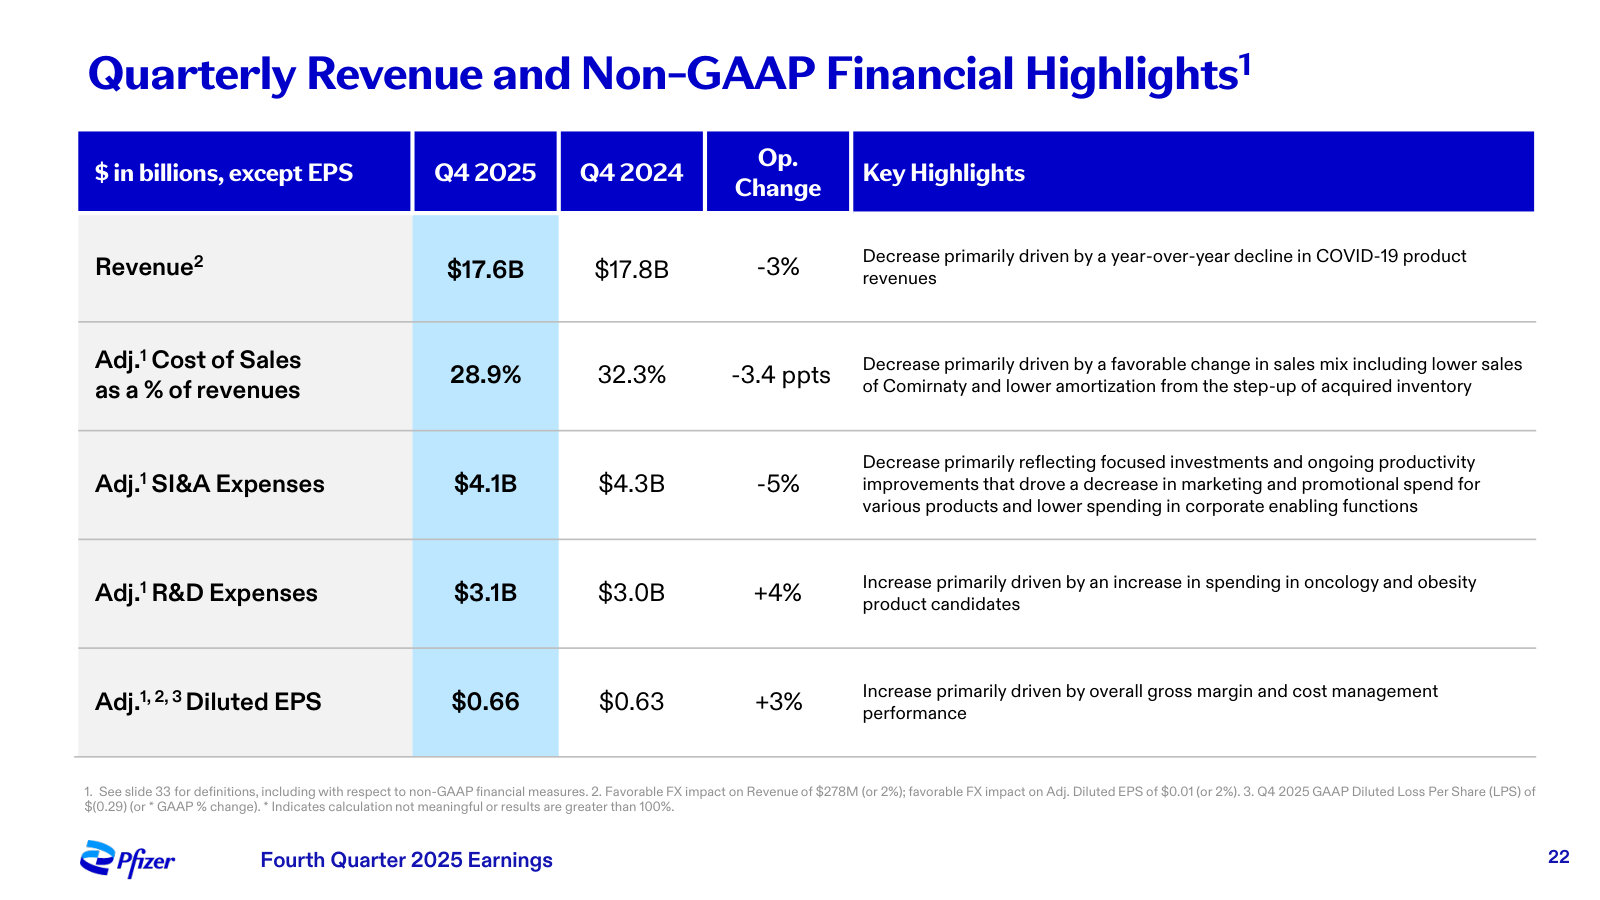
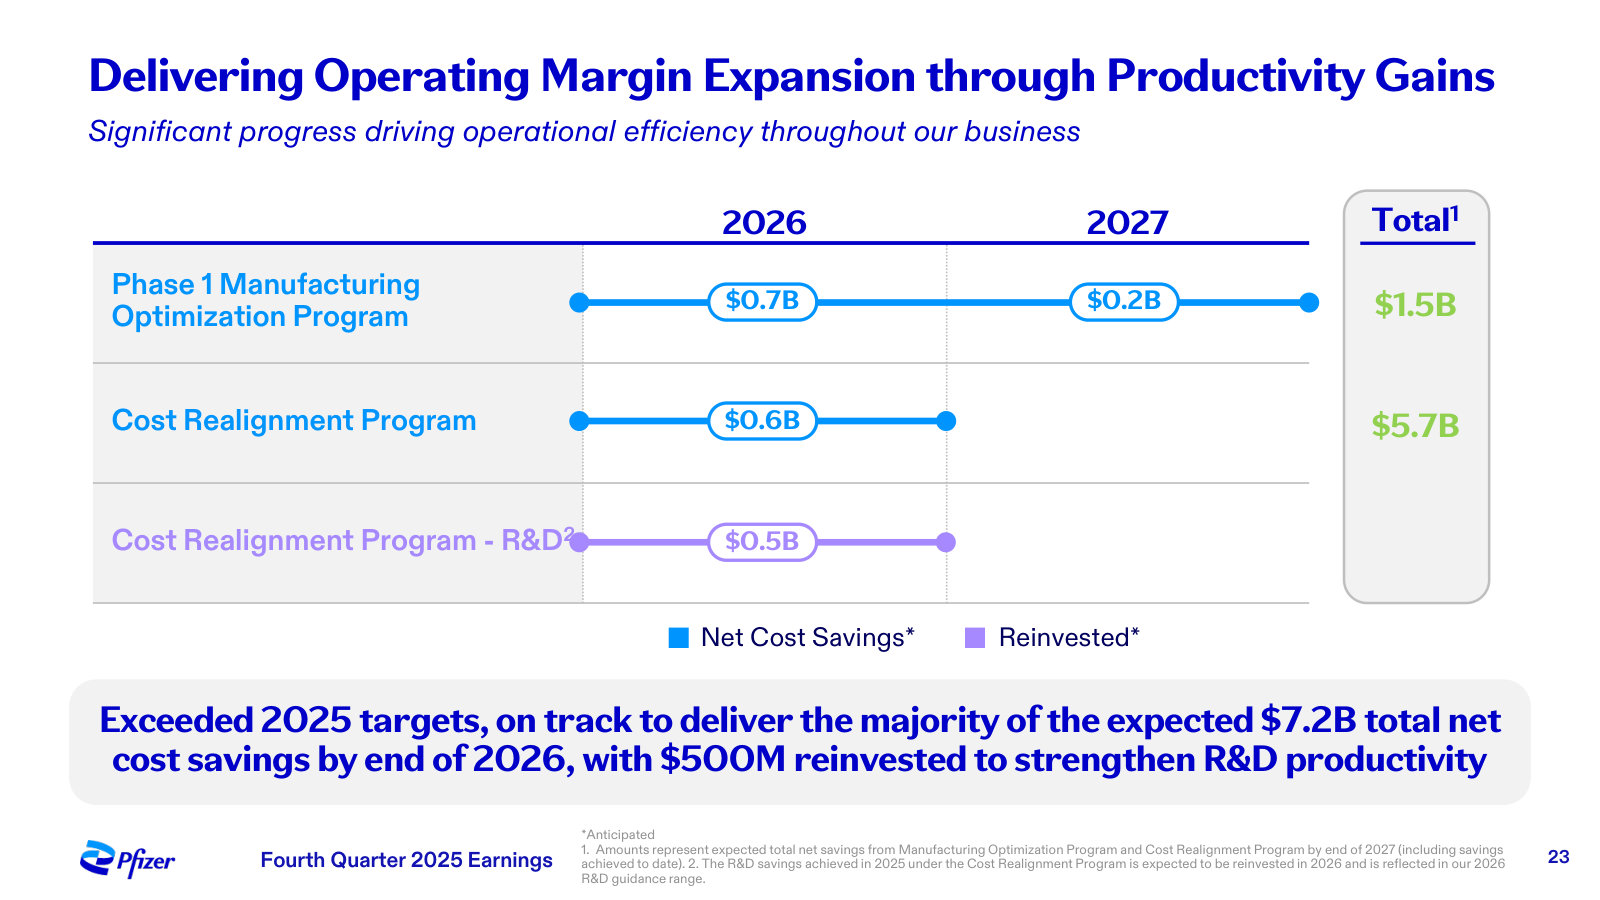
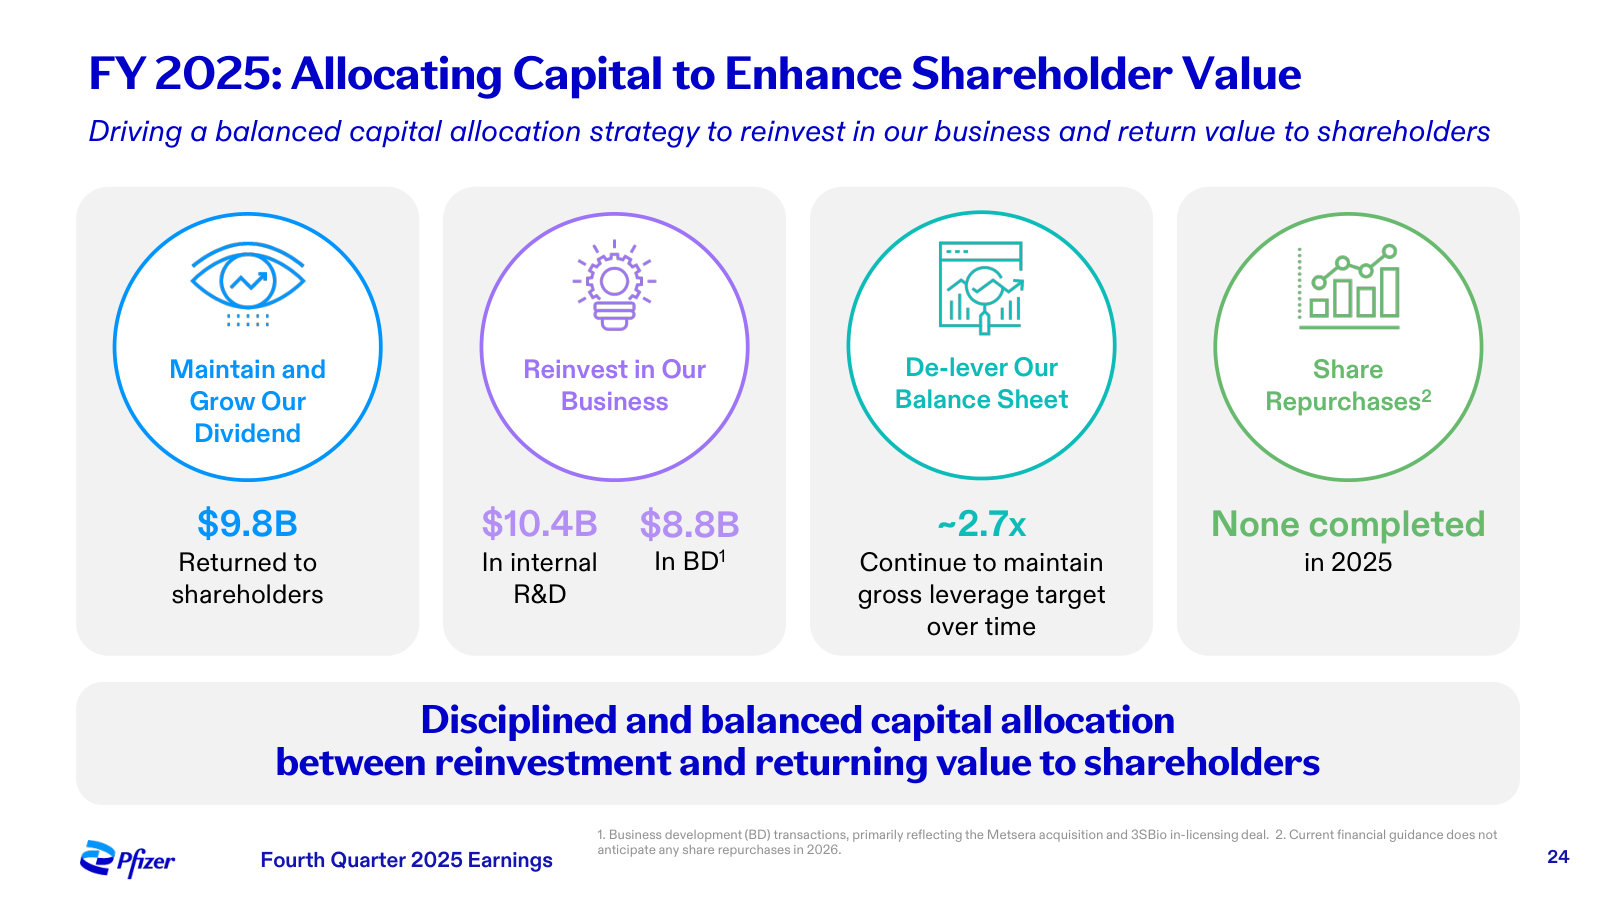
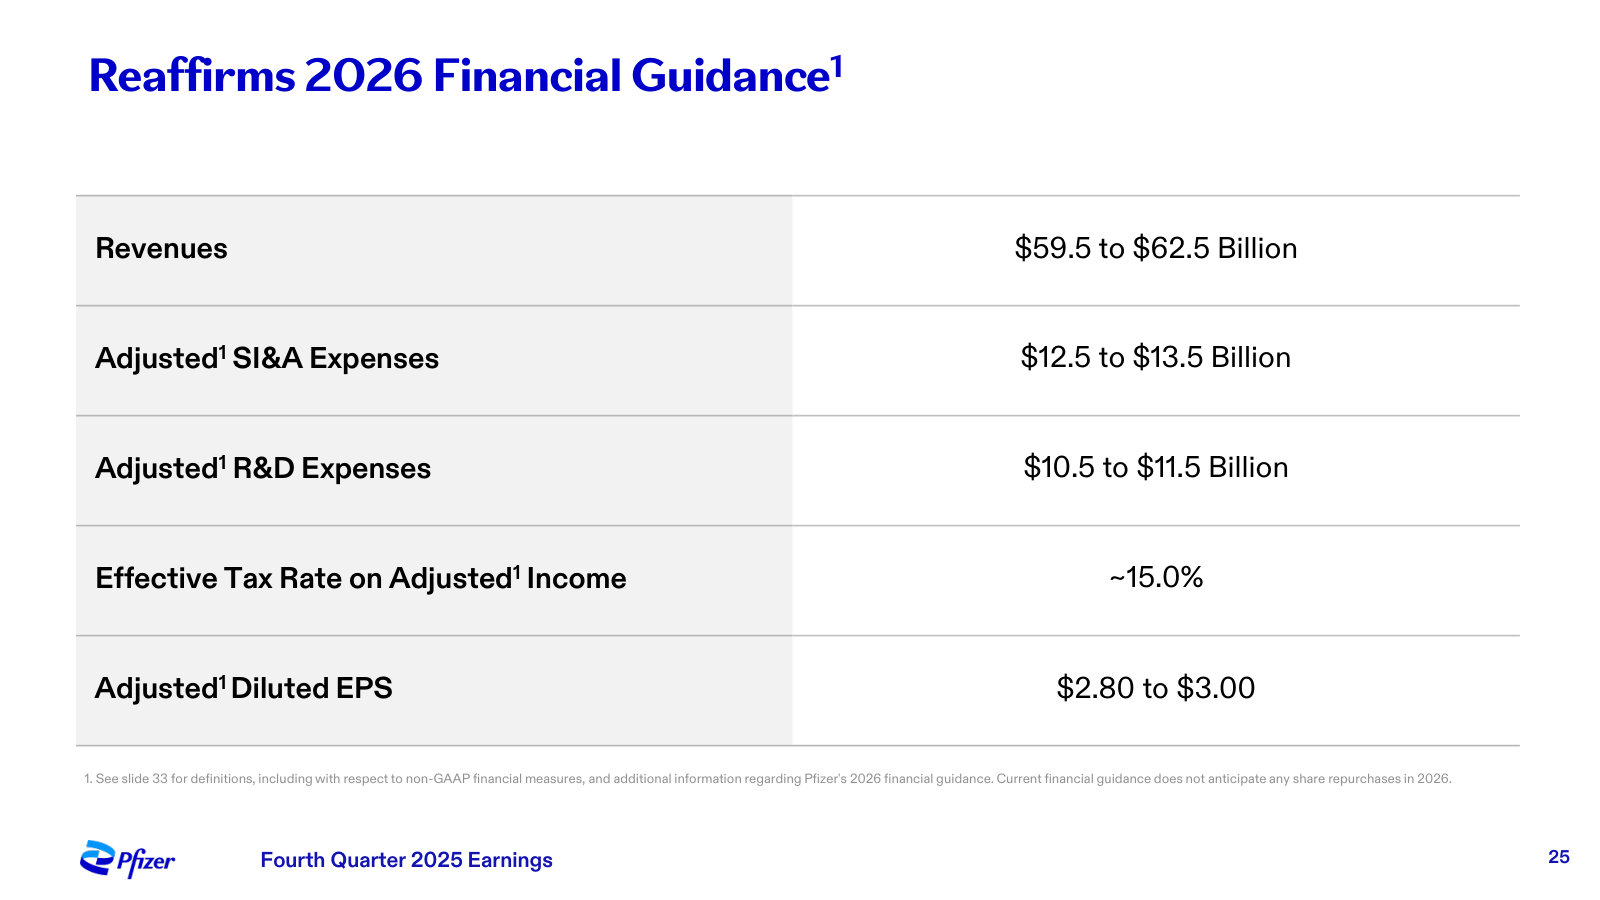
Fourth Quarter 2025 Earnings — Q4 / FY 2025
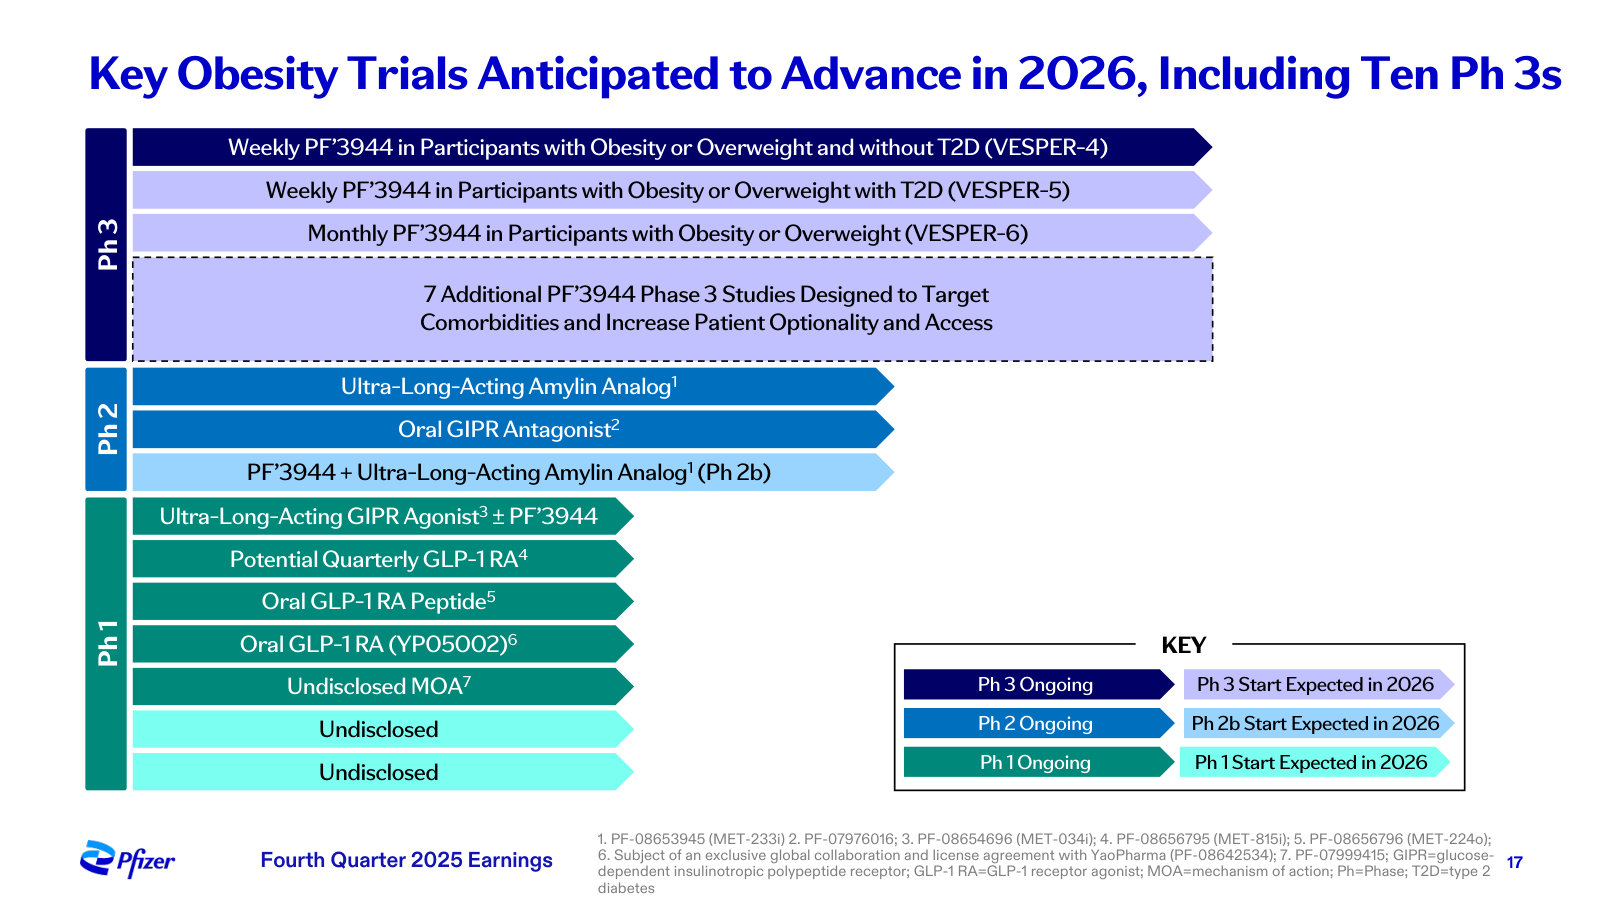
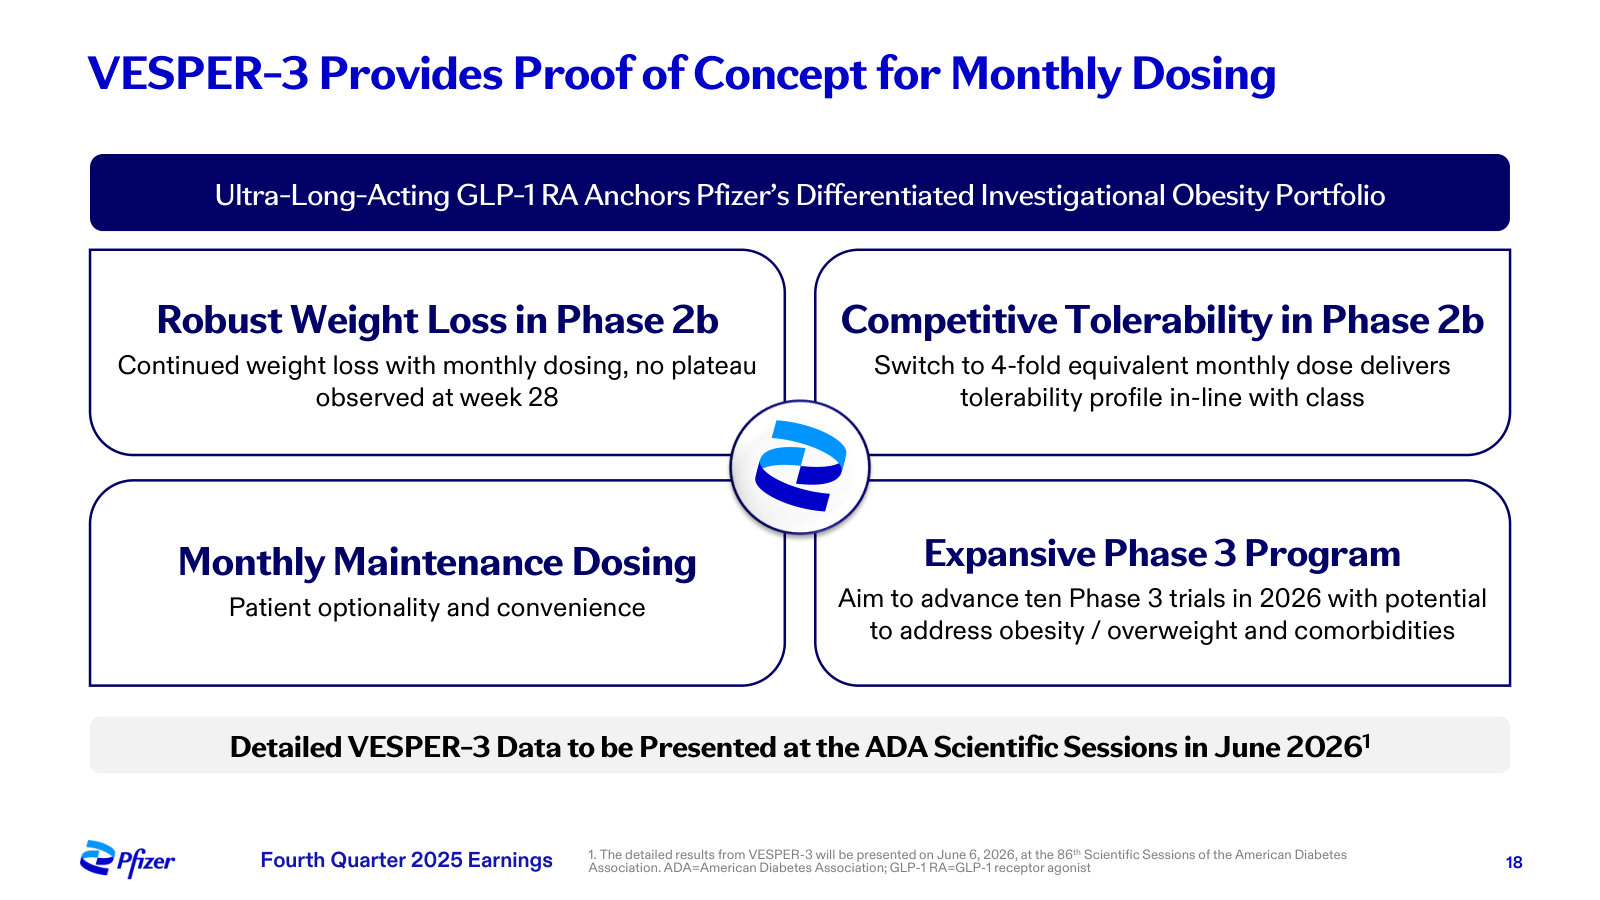
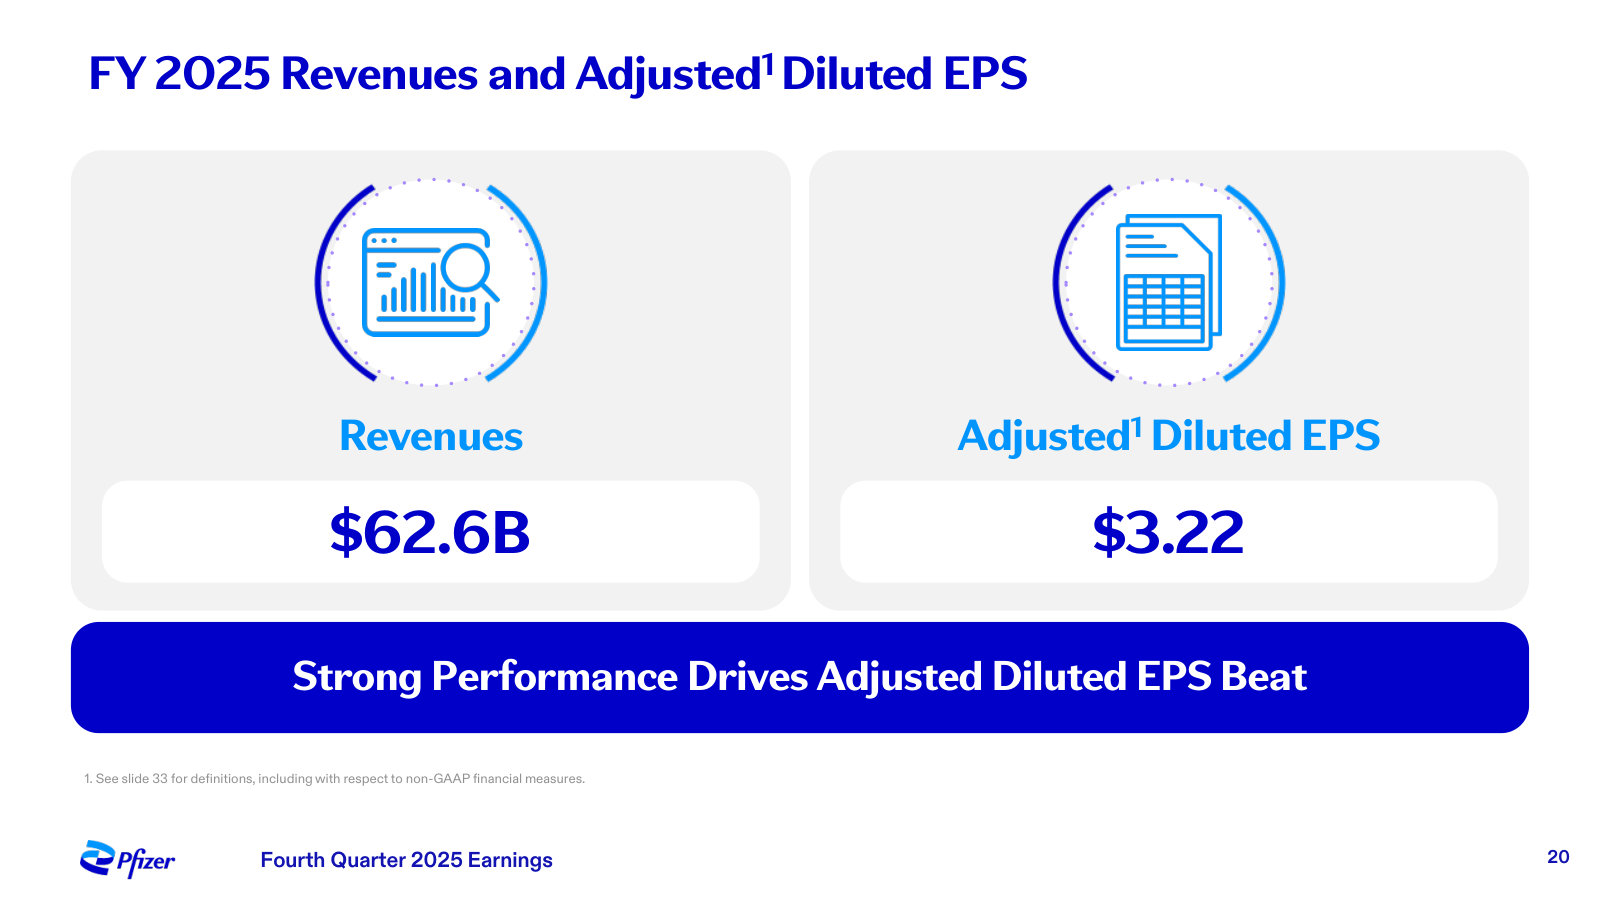
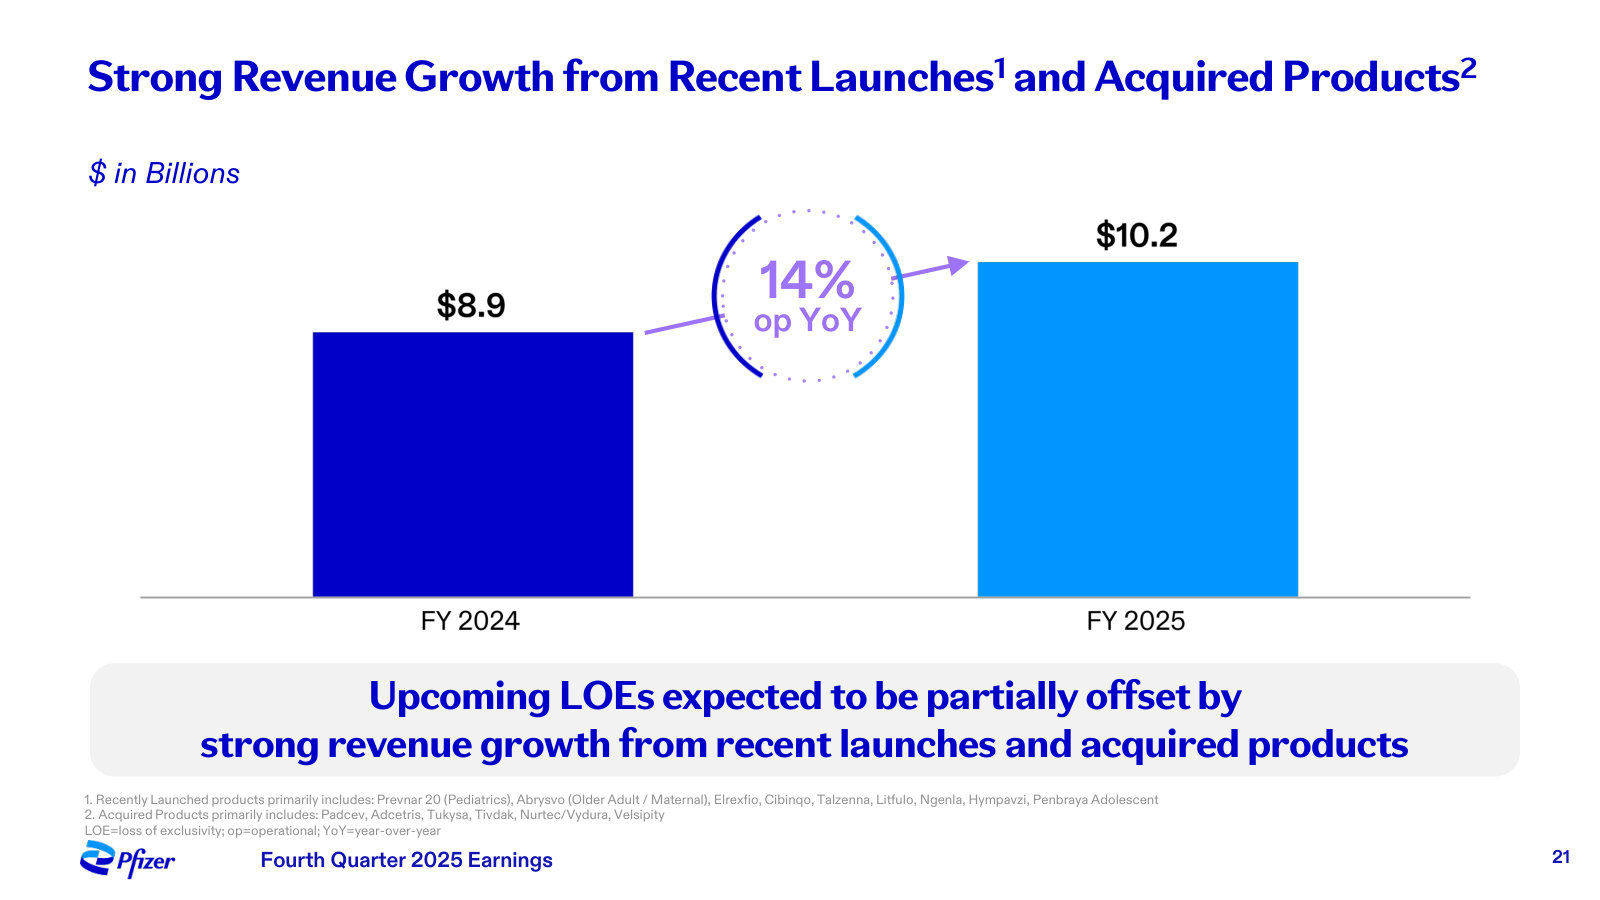
Management's fullest current statement of the whole company: FY2025 results, the 2026 strategy, the obesity bet and capital allocation. · Open the full document →
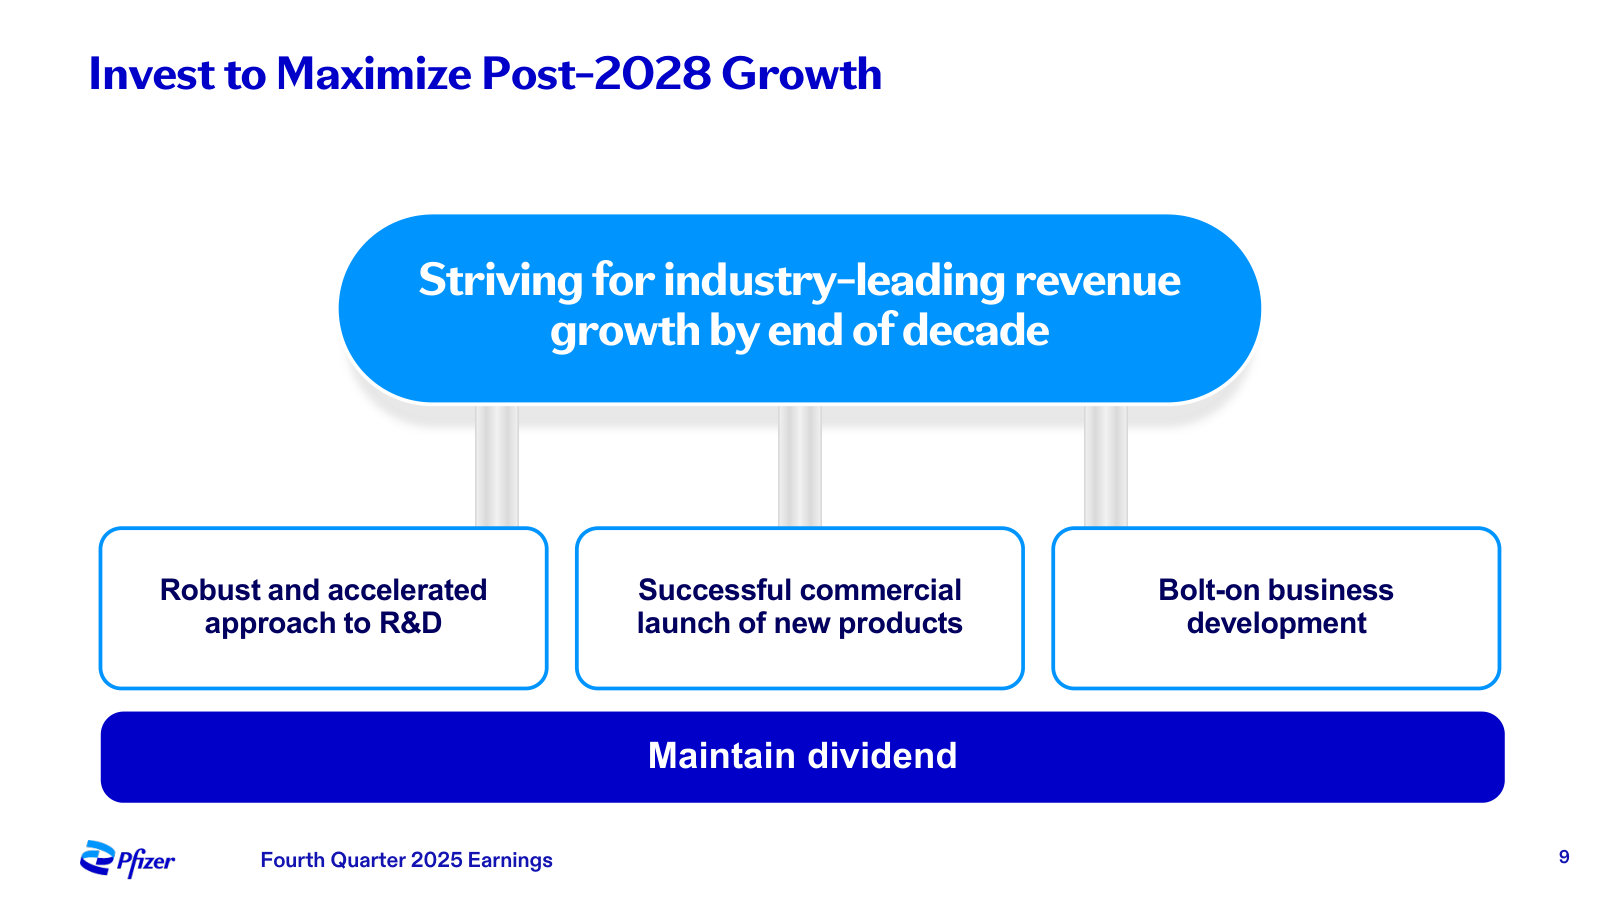
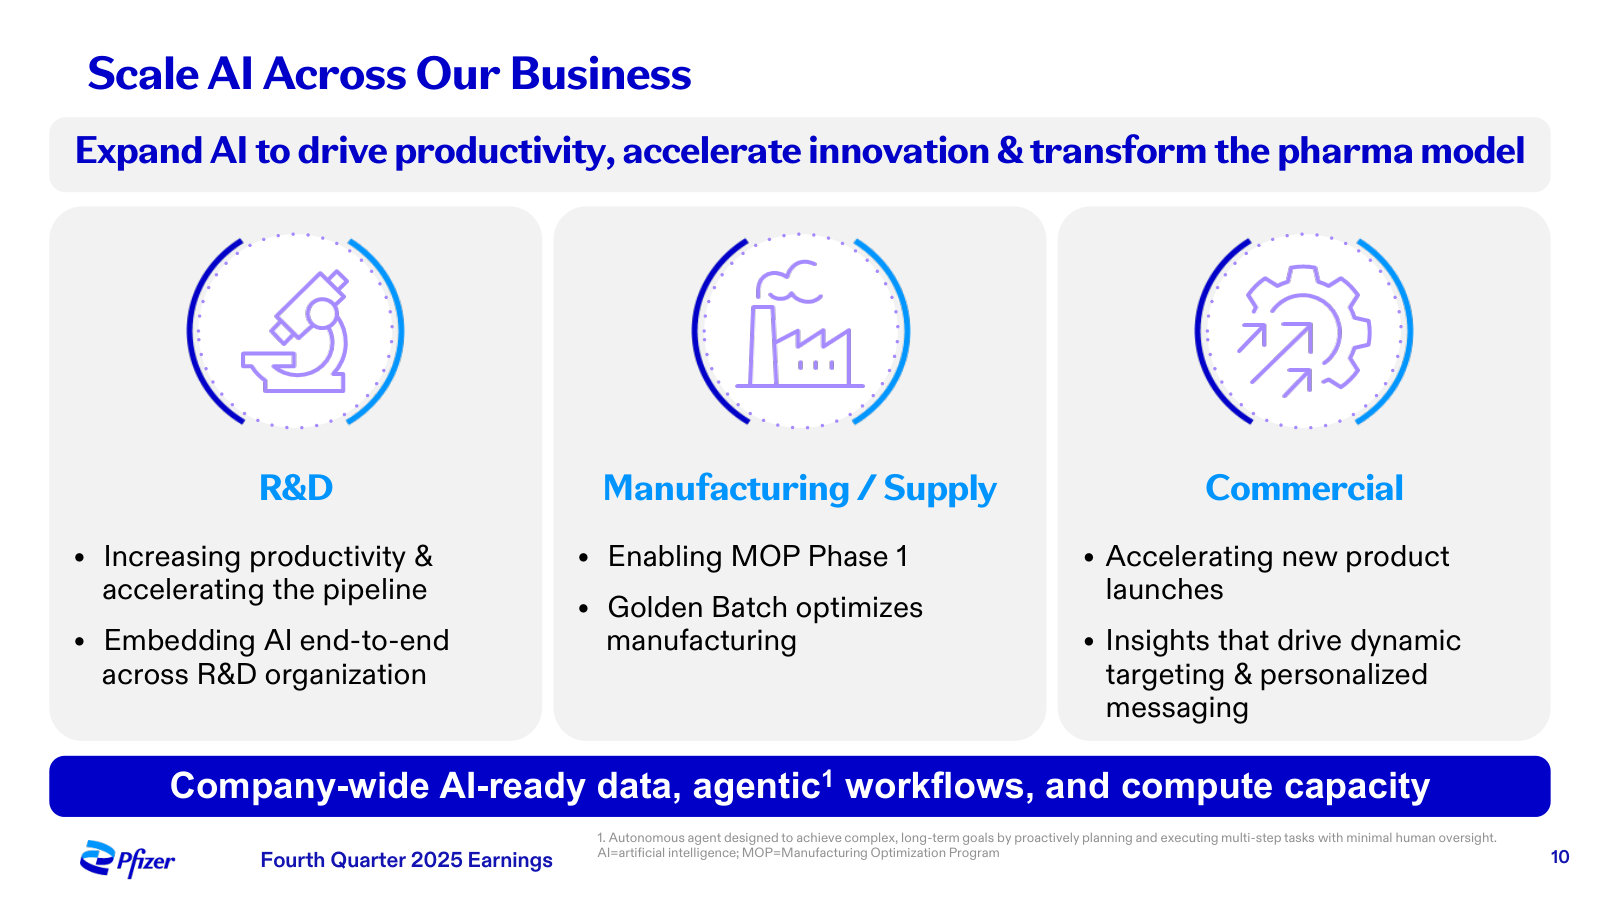
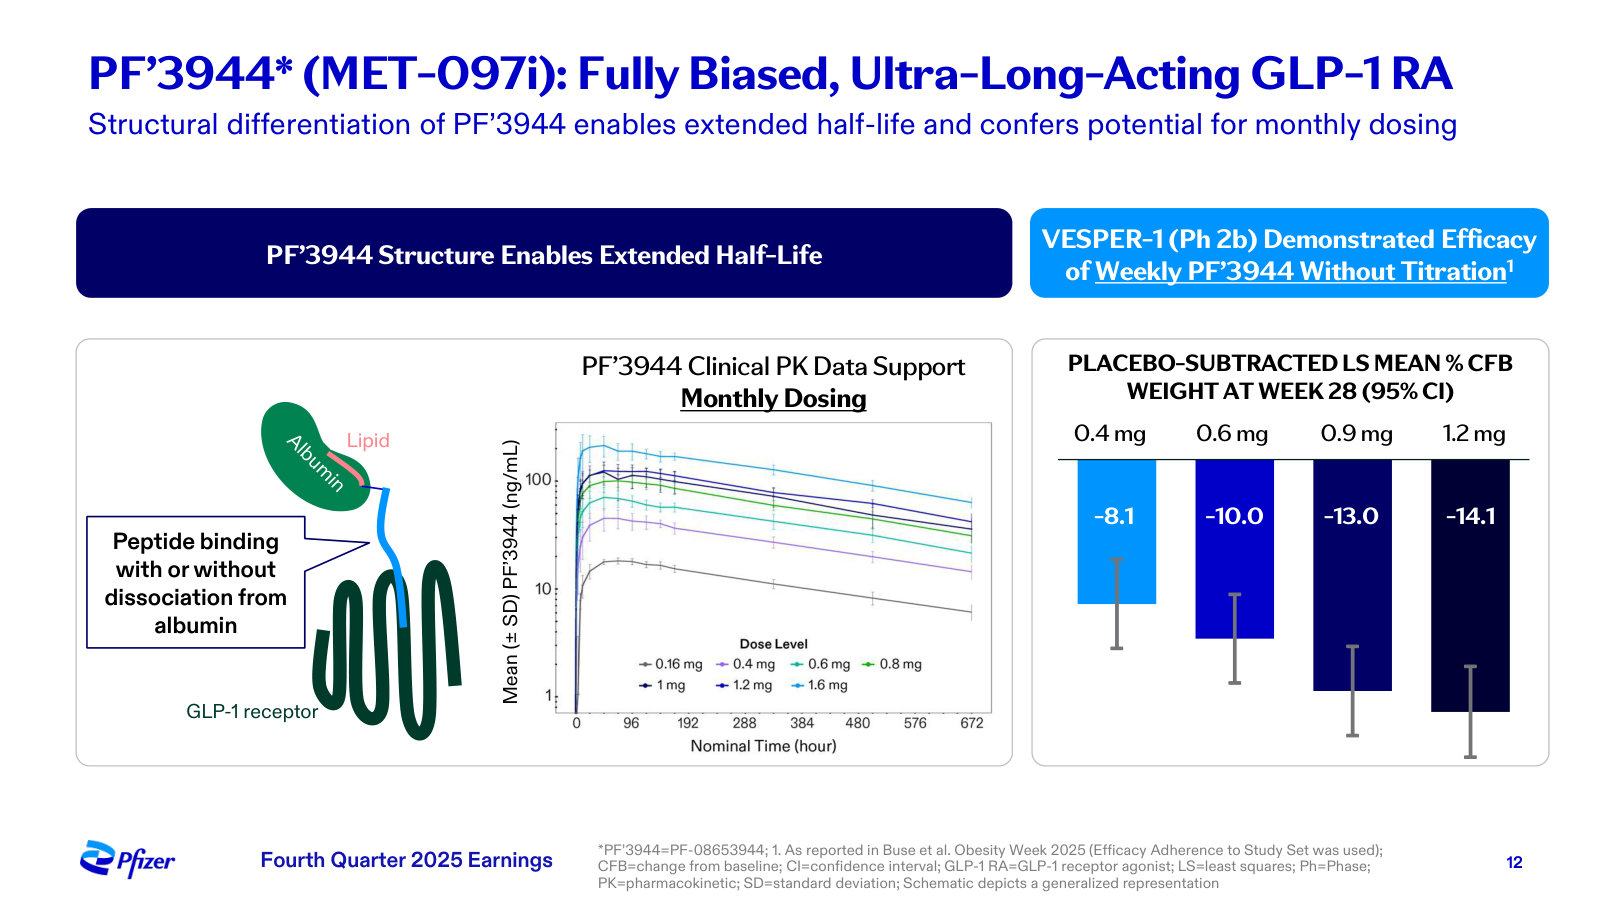
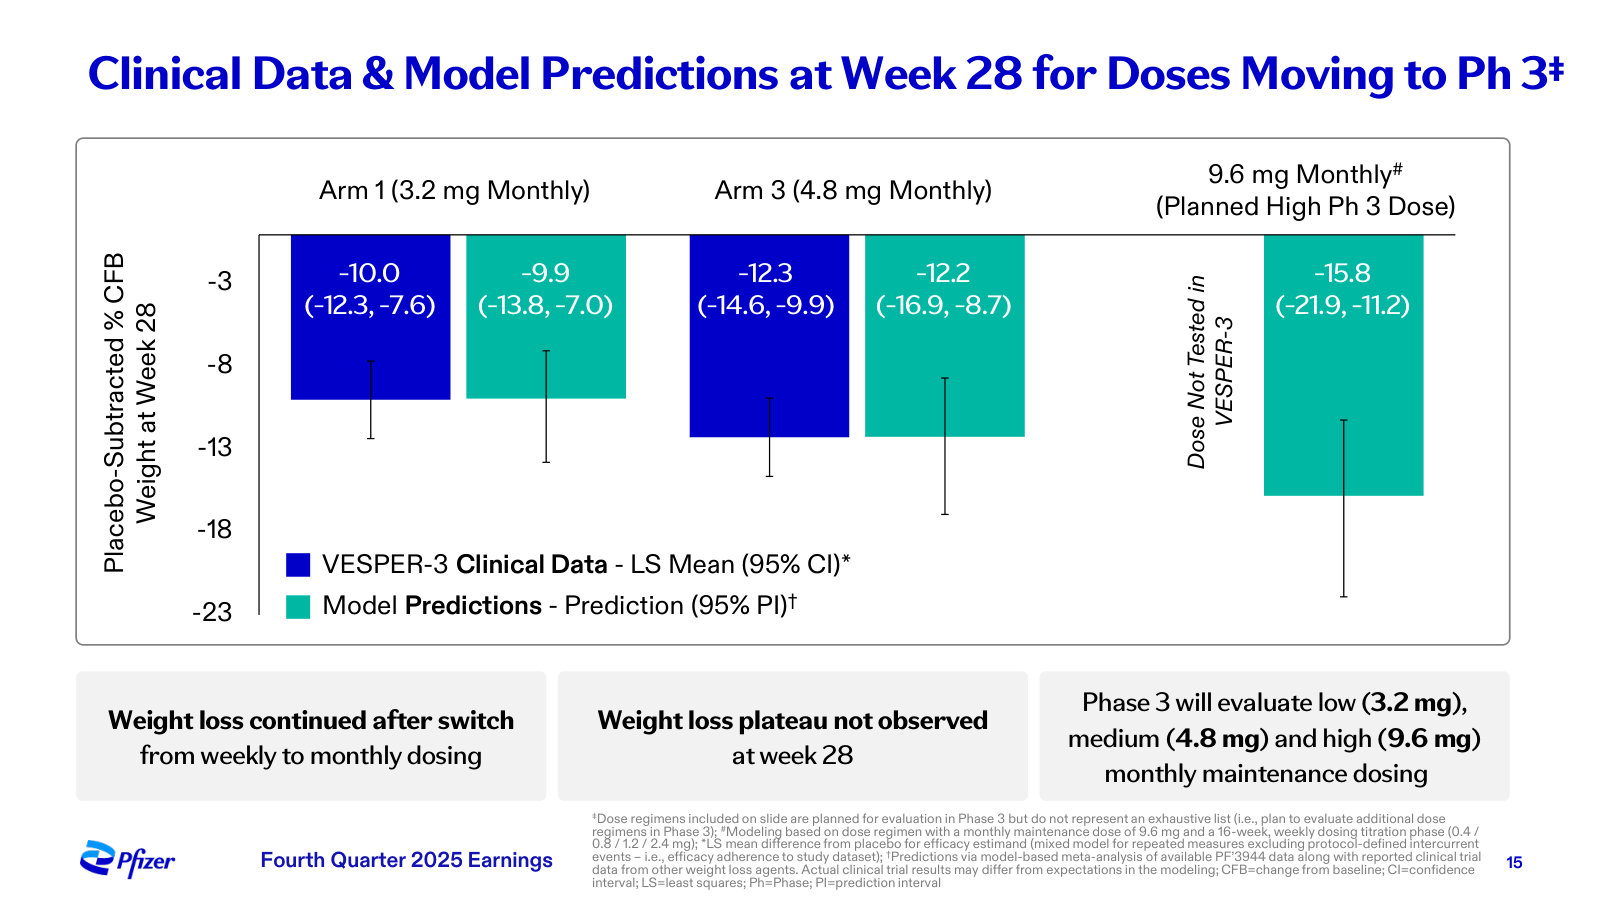
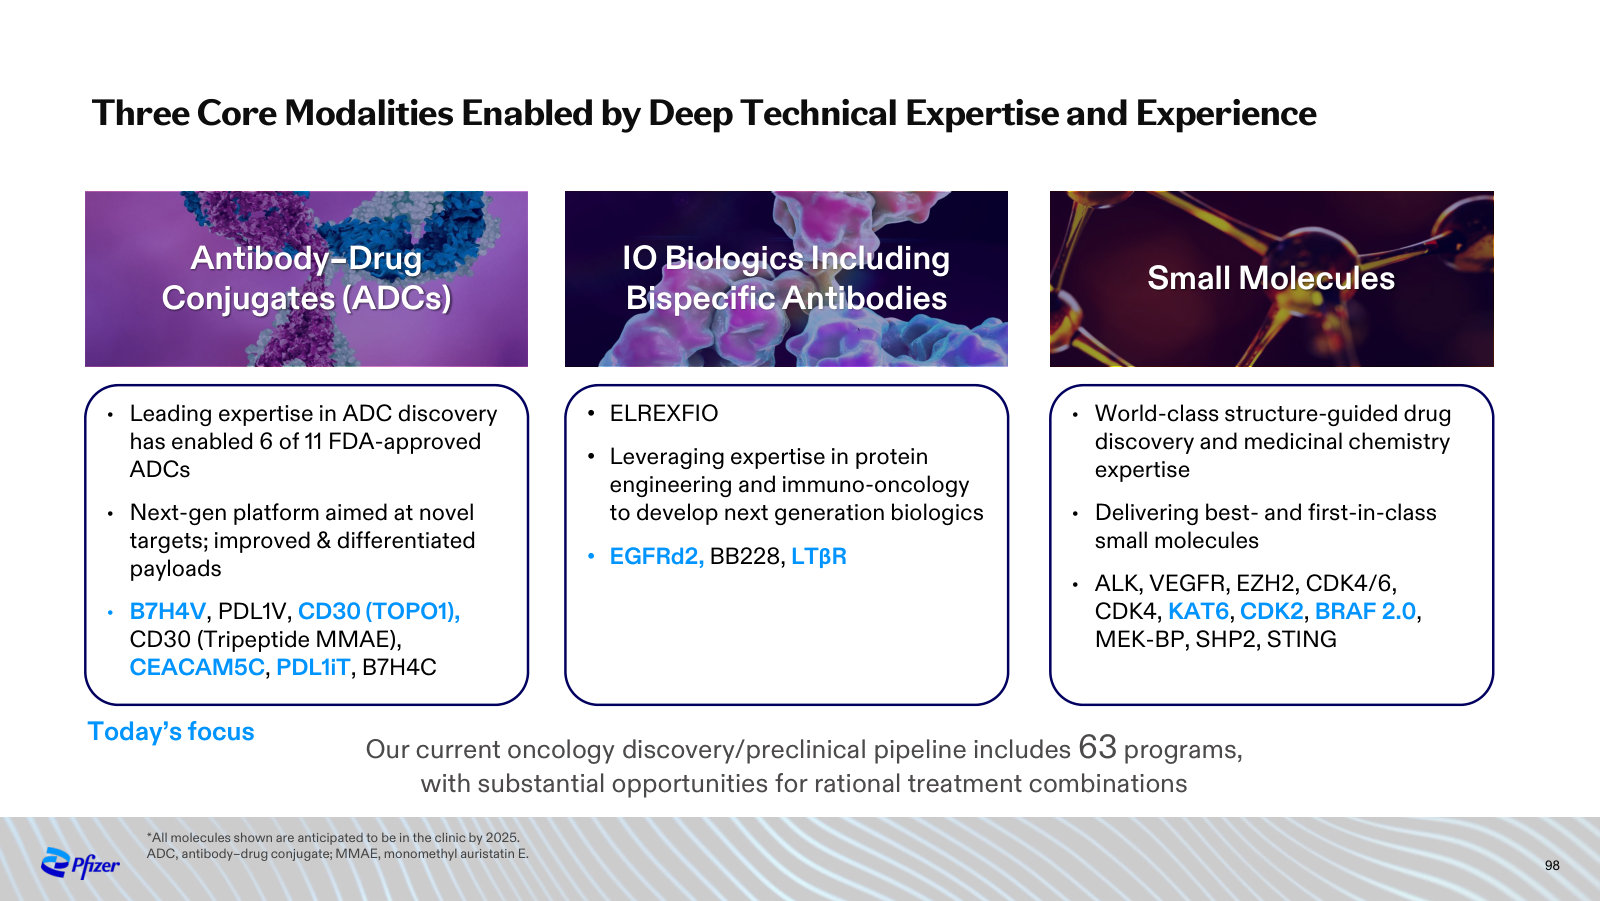
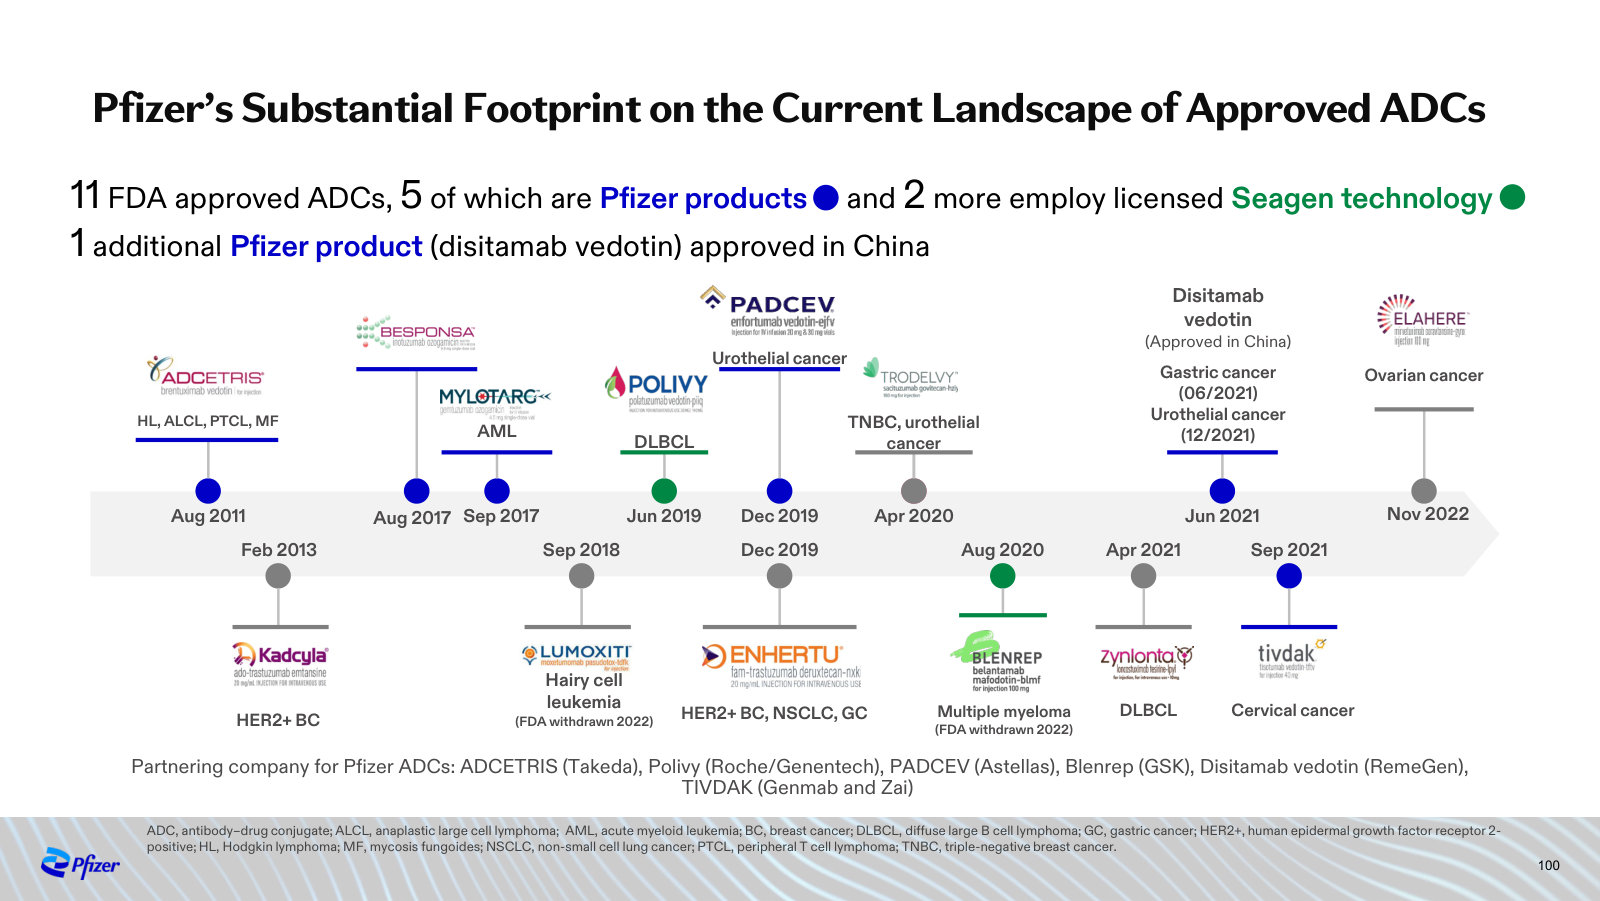
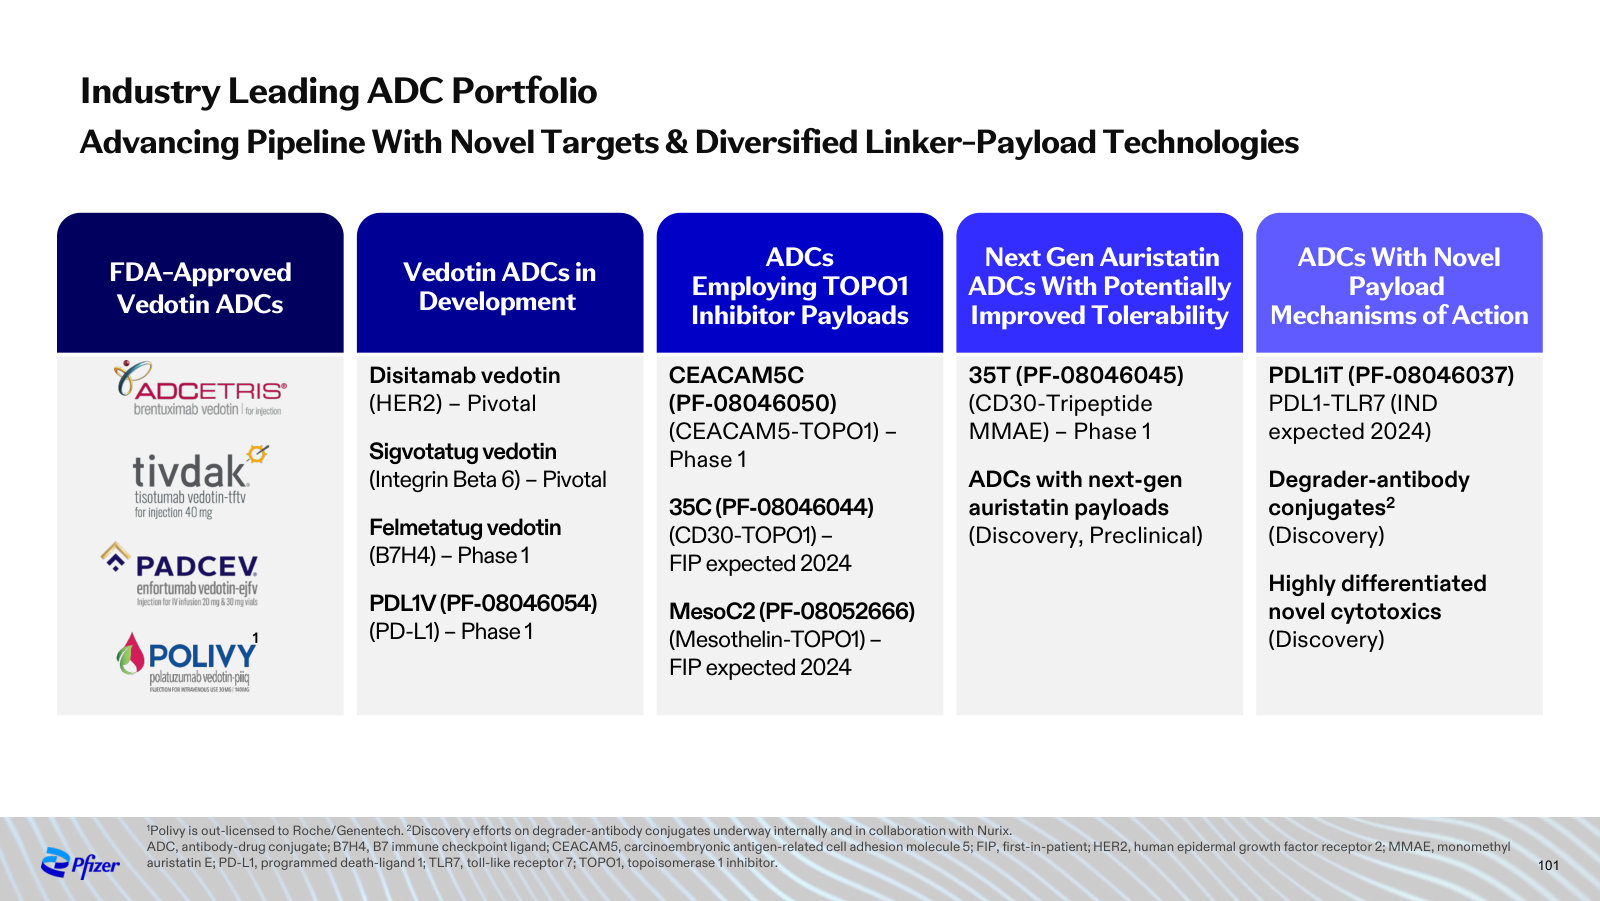
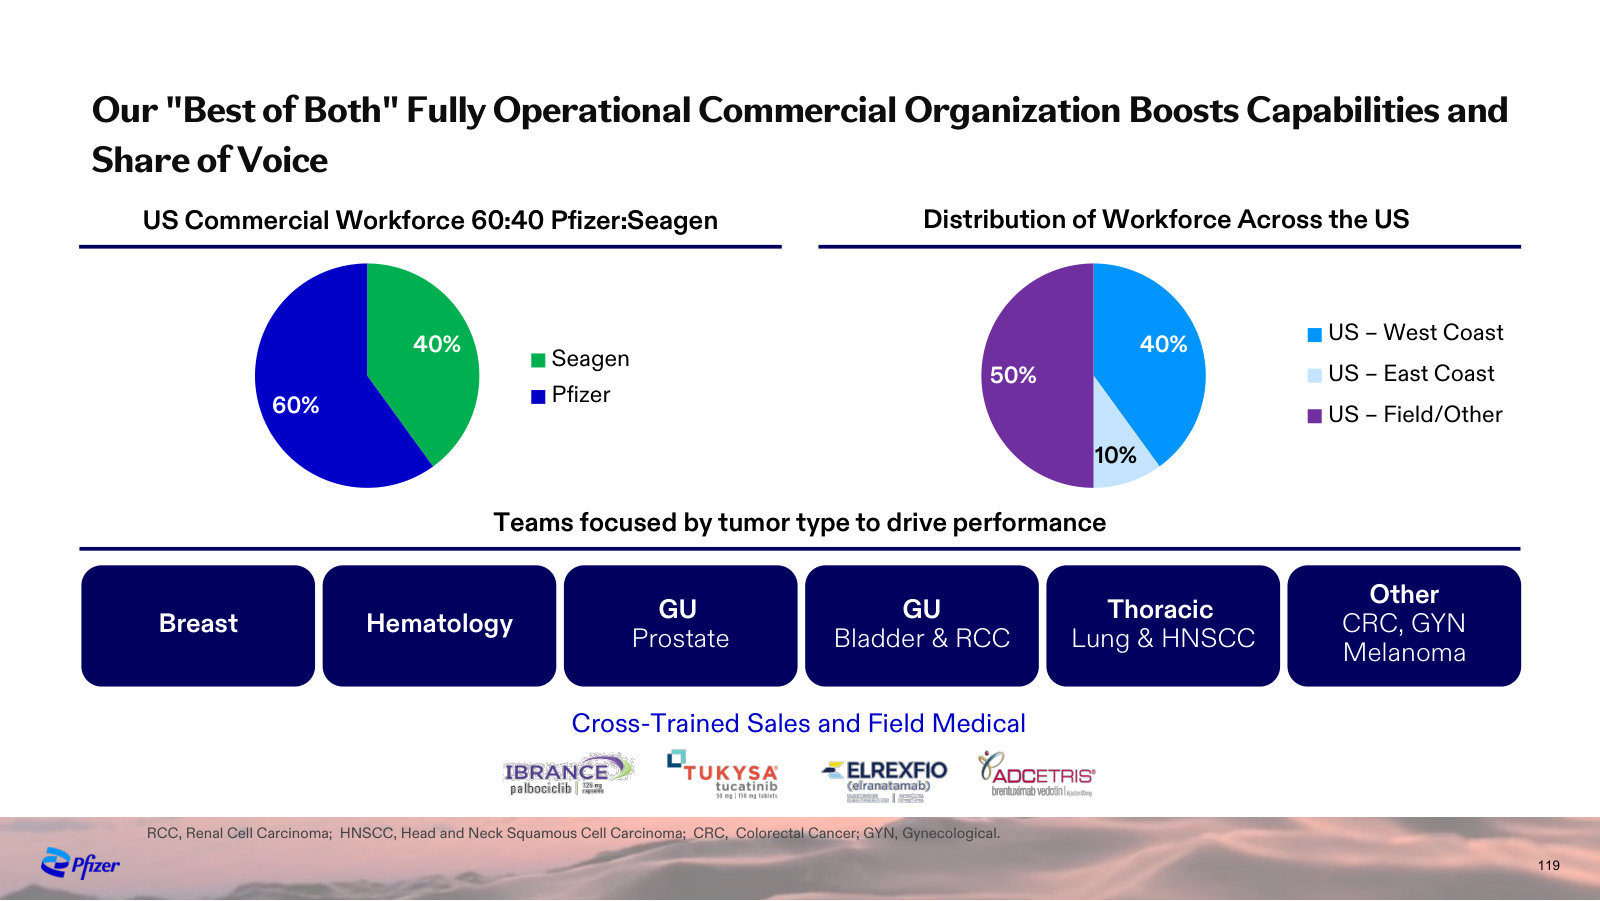
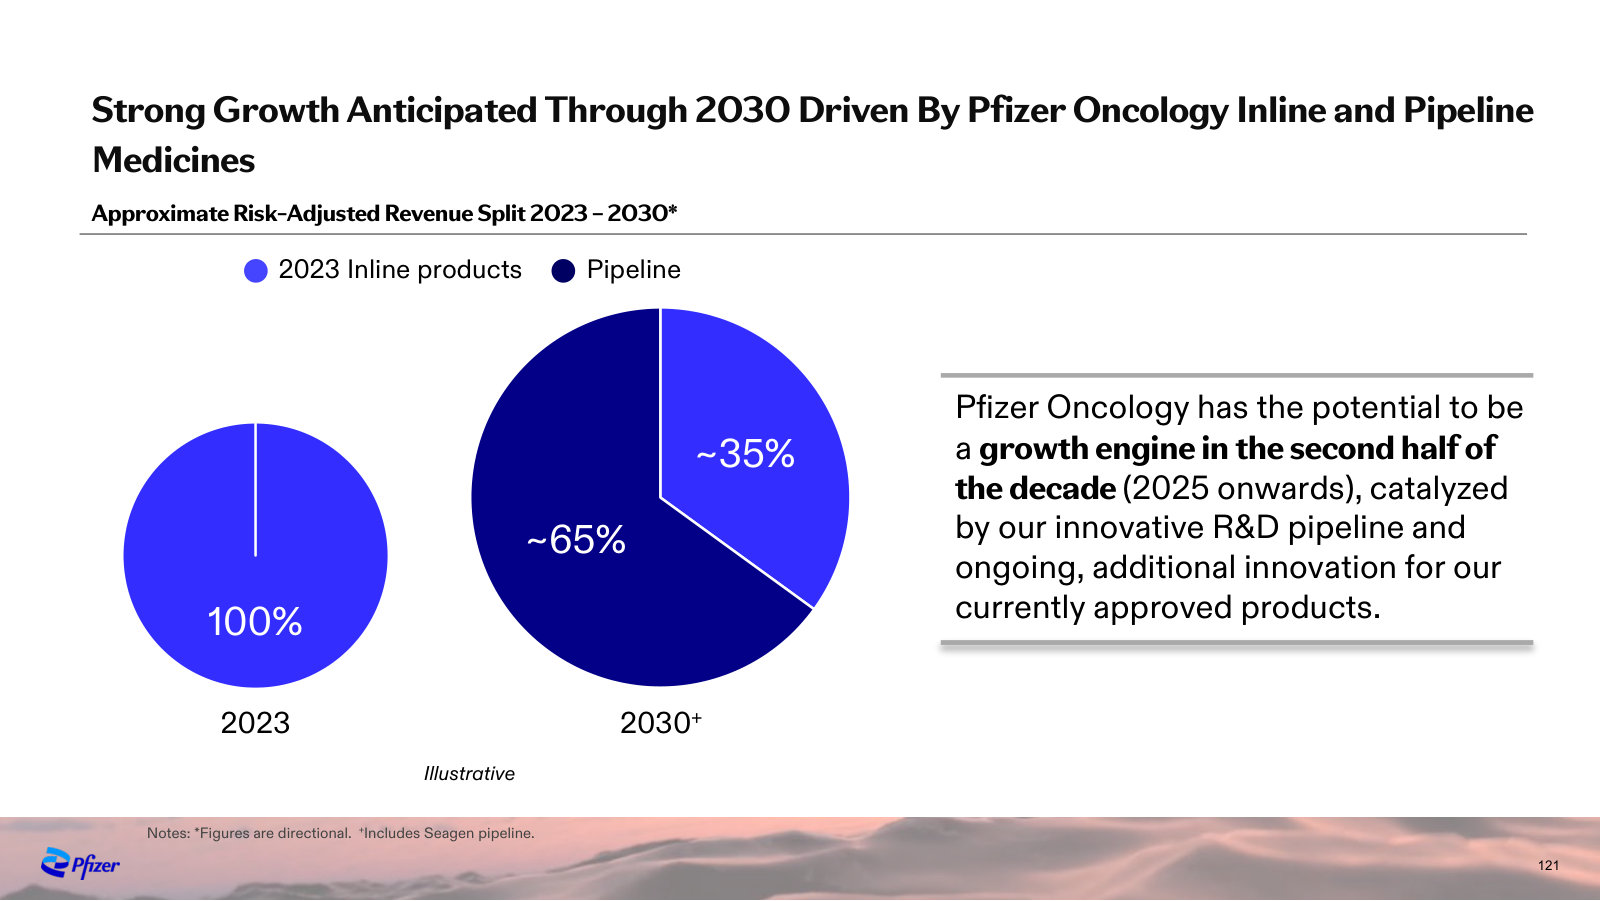
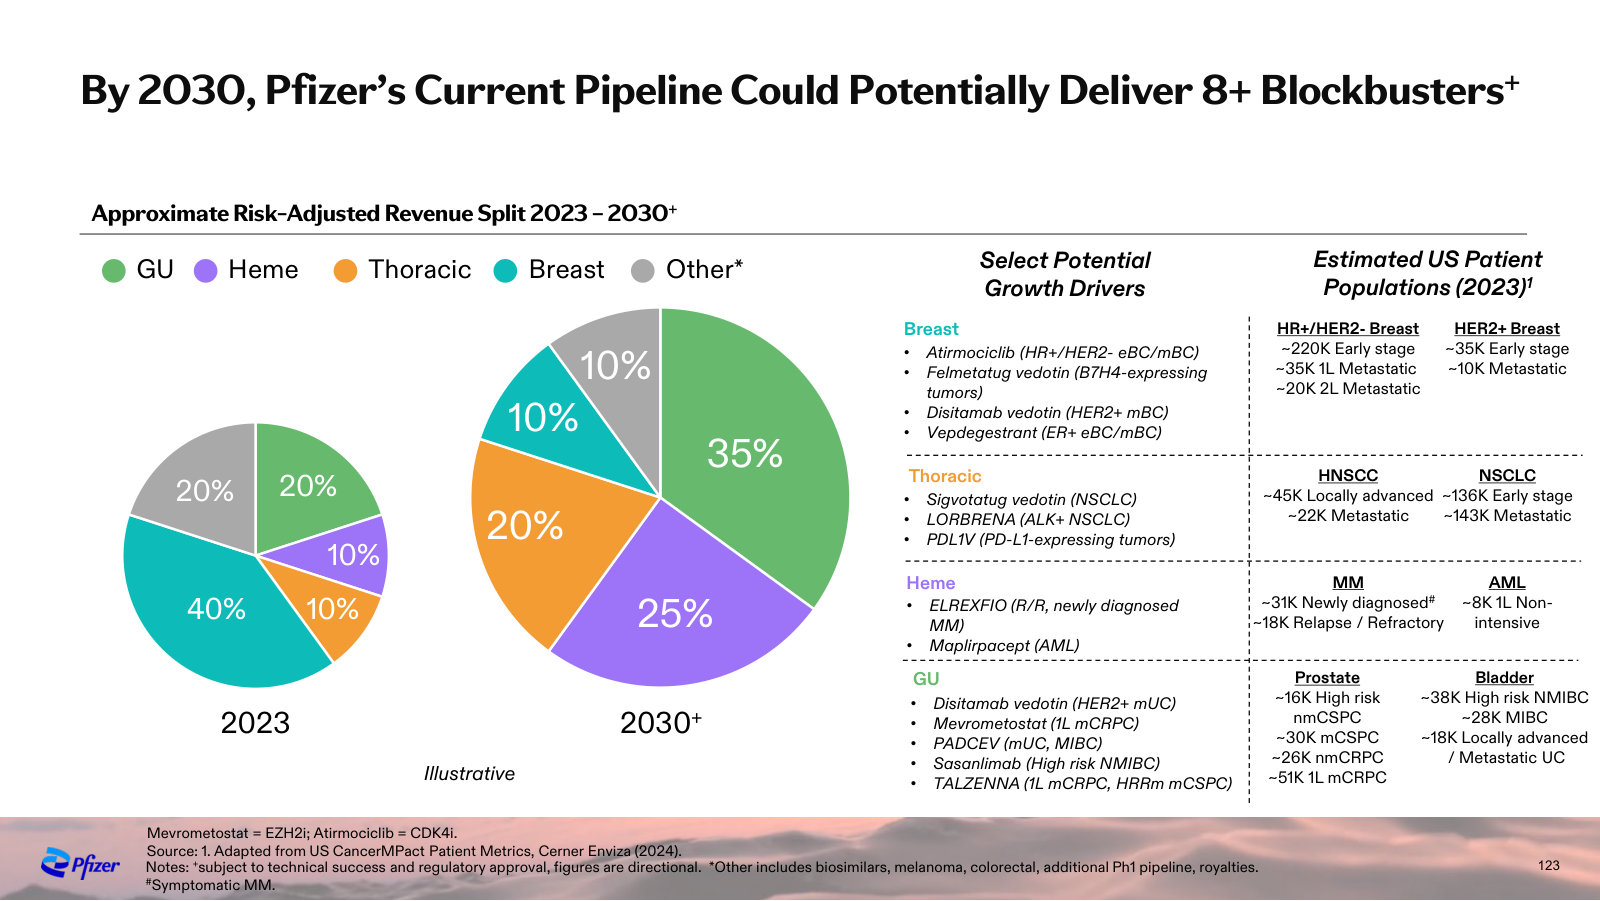
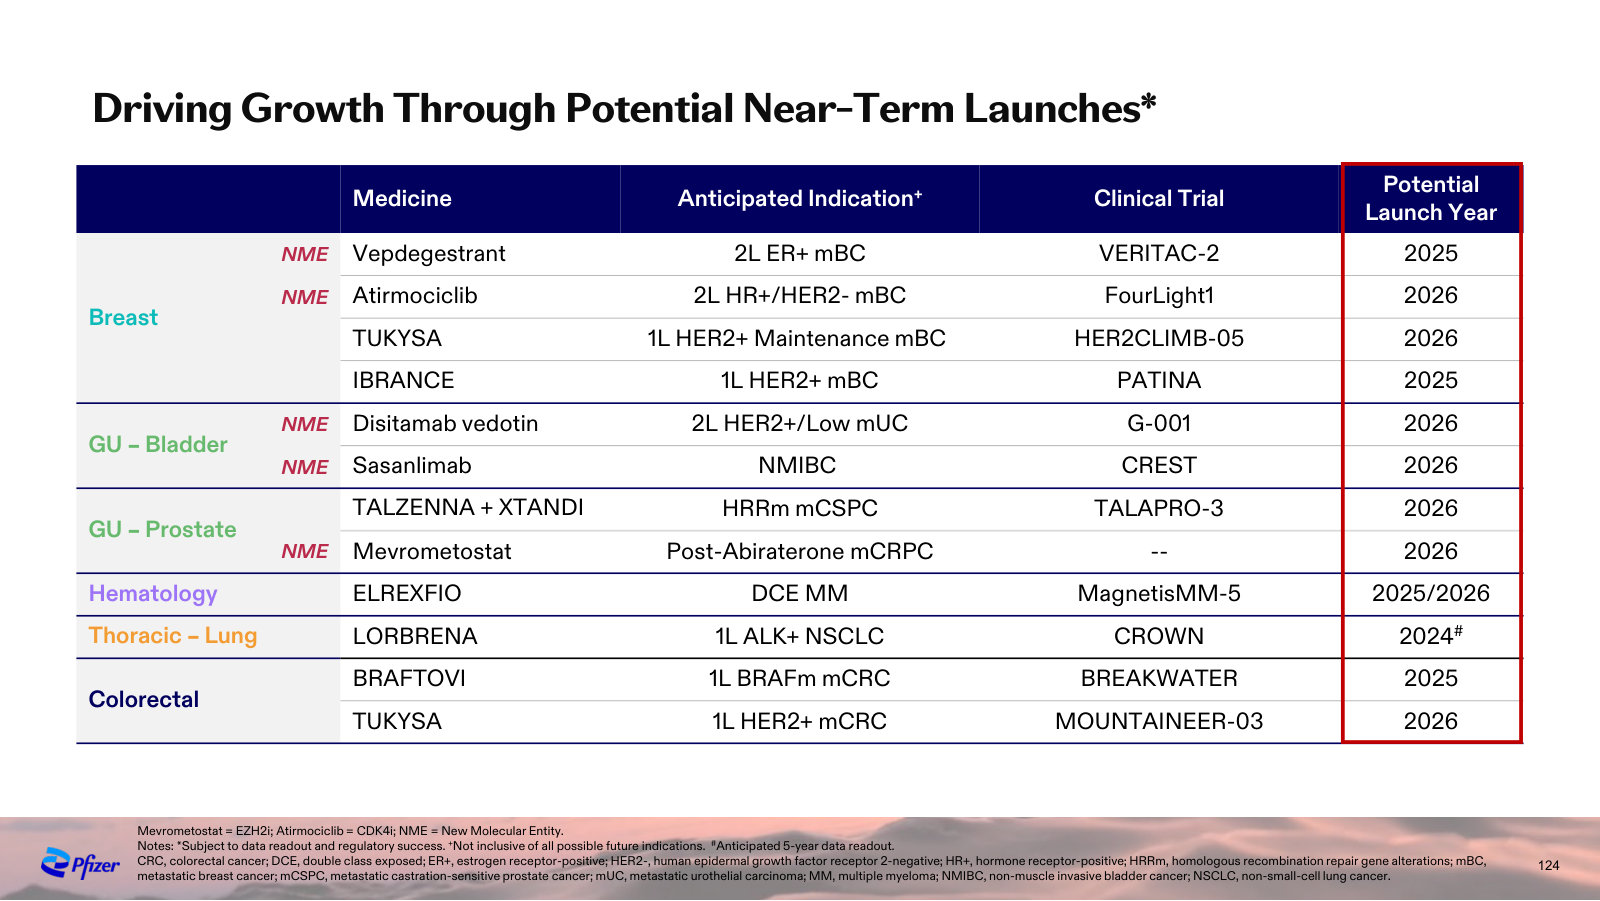
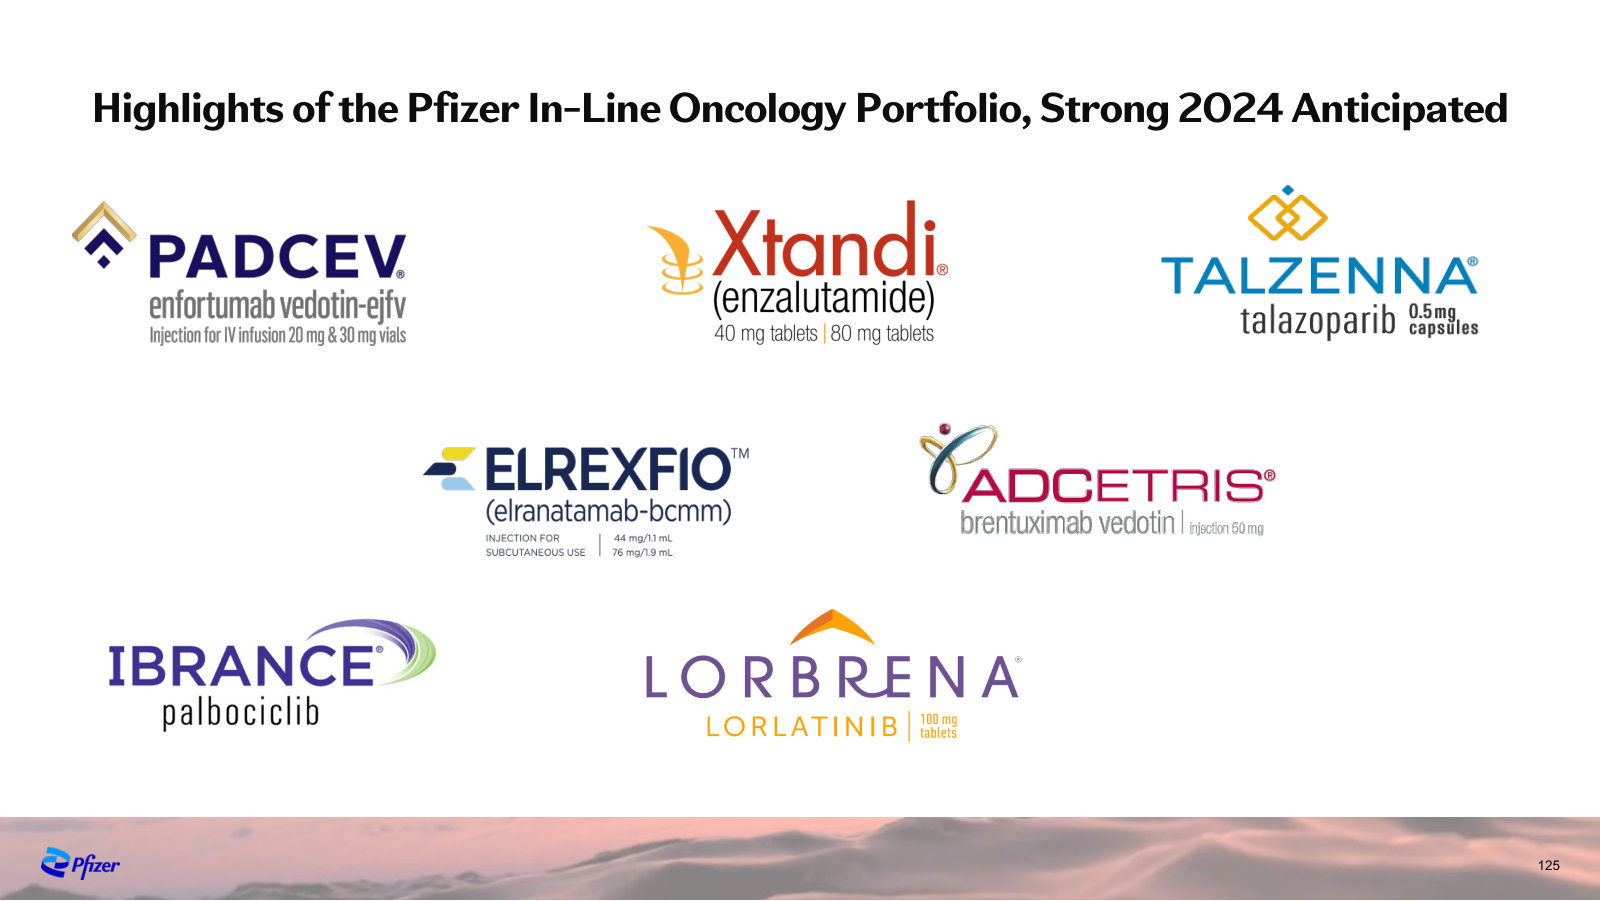
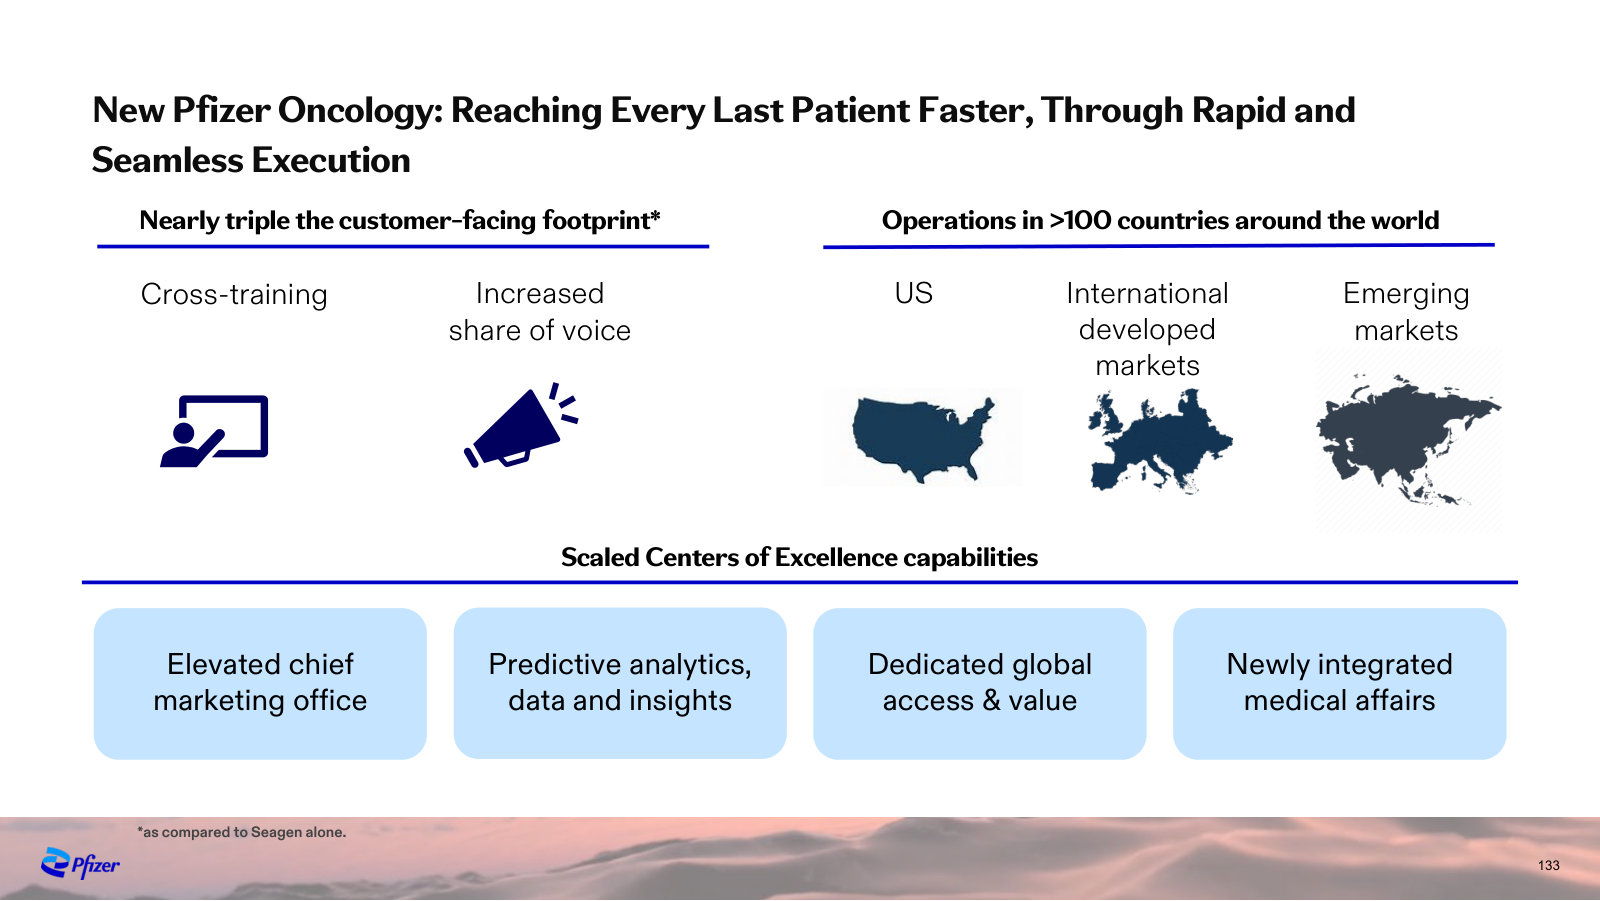
Oncology Innovation Day — 2024
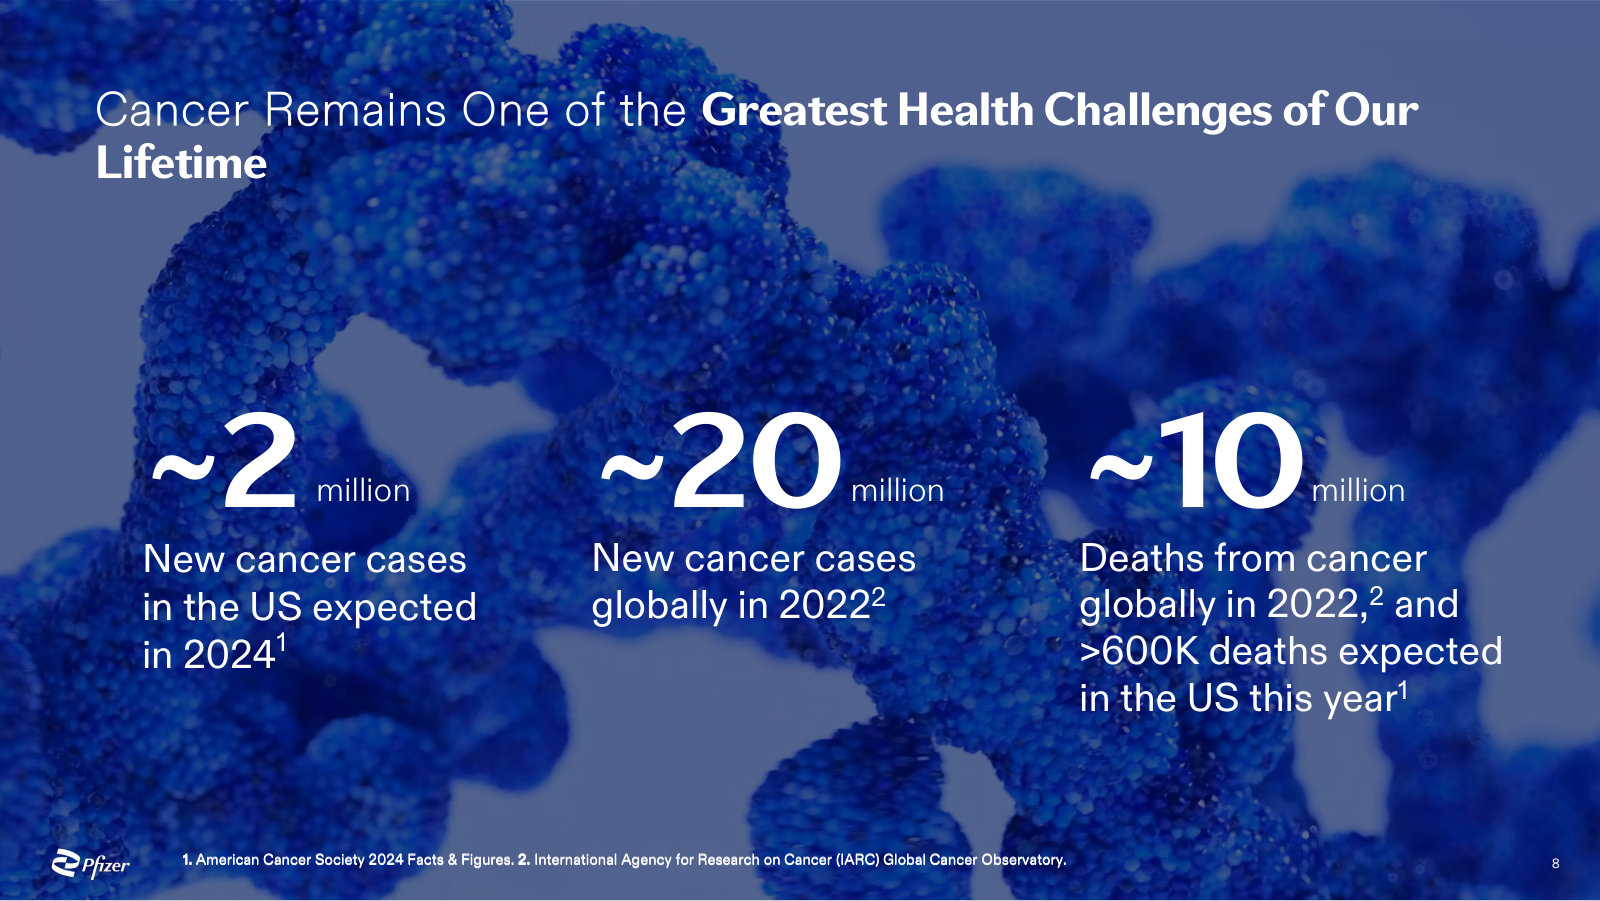
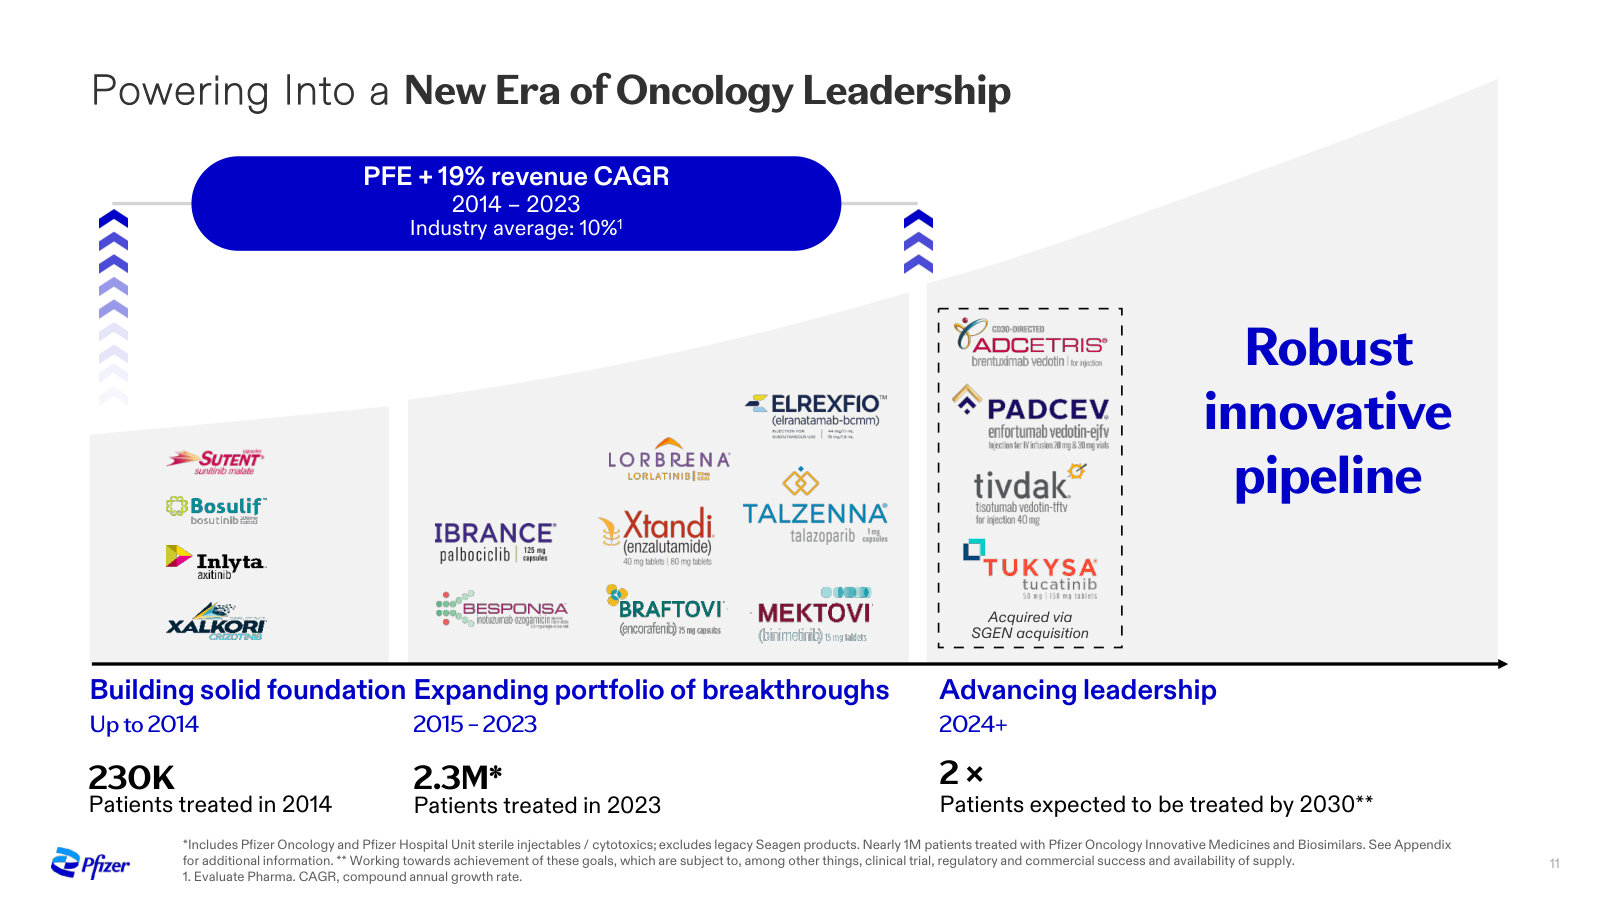
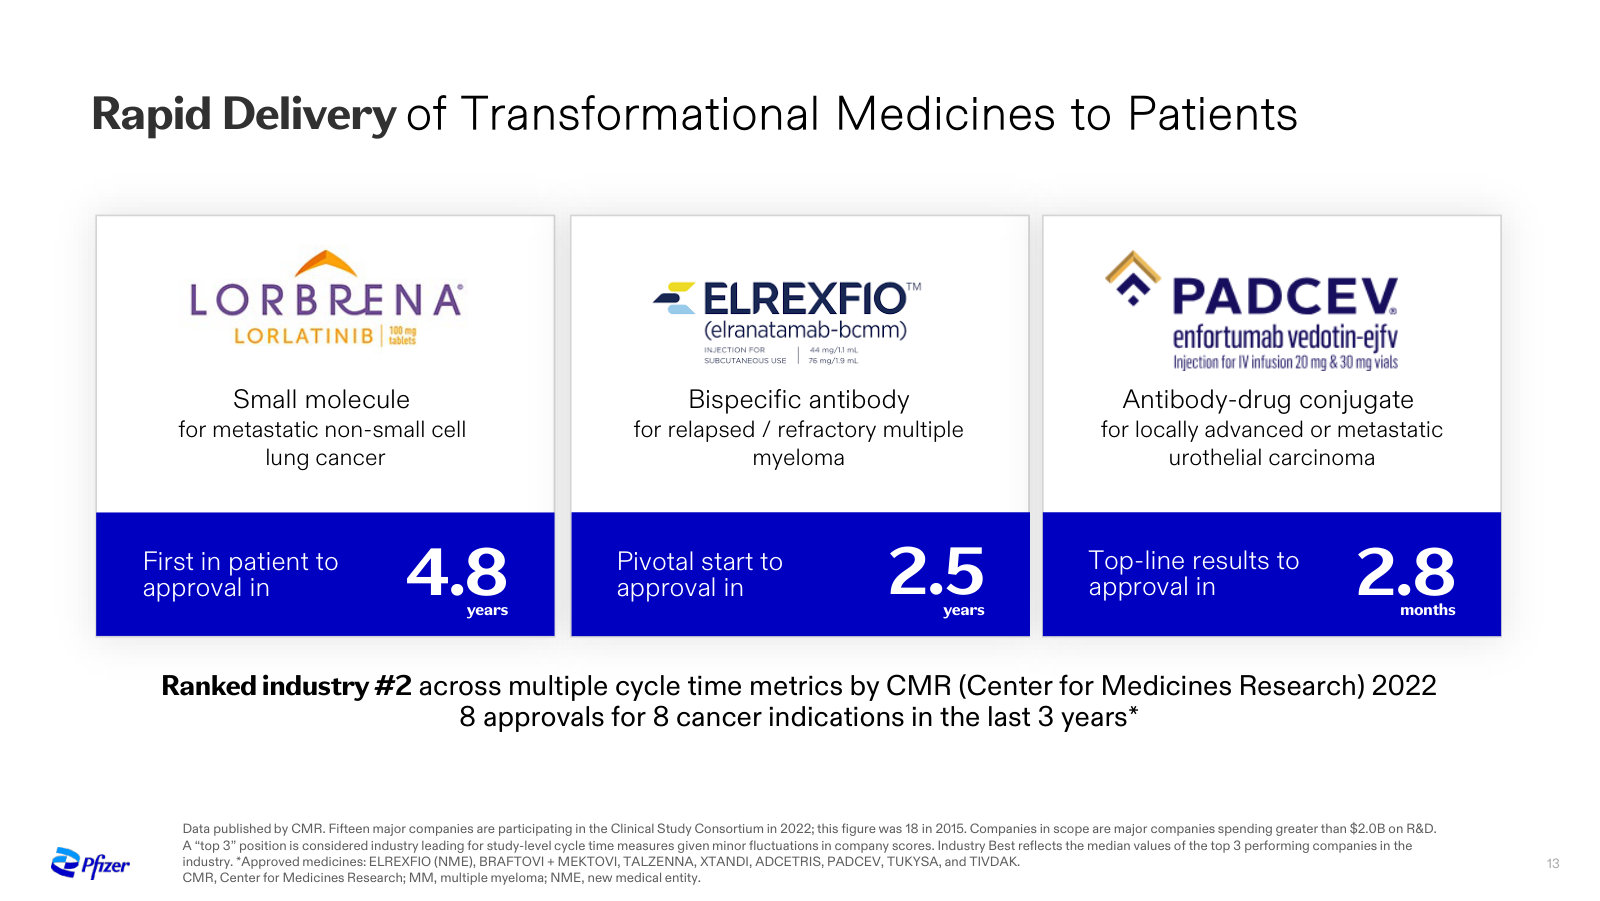
The one deep-dive investor day in the corpus, on Pfizer's central growth engine — the post-Seagen oncology business, its platform, portfolio and 2030 ambition. · Open the full document →
More from management
First Quarter 2026 Earnings — Q1 2026 · 25 pages · The latest quarterly print — how the year is tracking against the 2026 guidance in the featured deck. · Open →
Investor Overview — 2026 J.P. Morgan Healthcare Conference — 2026 · 8 pages · An 8-page standalone overview of 2026 guidance, the margin plan and pipeline catalysts, if you want the short version. · Open →
Fourth Quarter 2024 Earnings — Q4 / FY 2024 · 24 pages · The FY2024 baseline these 2025 results are measured against. · Open →
Investor Overview — 2025 J.P. Morgan Healthcare Conference — 2025 · 11 pages · The prior-year J.P. Morgan overview, for comparison with the 2026 edition. · Open →
Pfizer Inc.'s management answers for the business every quarter. These are the exchanges that explain it best — verbatim, from the call transcripts preserved in Sources. Each link opens the full transcript at that page in a new tab.
Q1 2026 Earnings Call — Q1 2026
The current thesis in one call: how a patent settlement reset the post-2028 growth story, and why a clear beat still didn't lift guidance. · Open the full transcript →
The Vyndamax patent settlement is the quarter's real news: it pushes a $6bn+ LOE out ~2.5 years and restores a post-2028 growth claim.
Albert Bourla (Chairman and CEO): We also had two significant legal developments that improved our growth profile post-2028 and, of course, our cash flow outlook. Our recent settlement agreements resolving infringement of patents related to Vyndamax have the potential to change the growth profile of the company significantly post-2028. This gives us greater confidence that starting in 2029, we will enter a five-year period of high singledigit revenue CAGR.
p. 1 · Read in context →
The print and the offset engine: $14.5bn revenue, ~7% ex-COVID, and $3.1bn of launched/acquired products (+22%) meant to blunt the LOEs.
David Denton (CFO): In the first quarter of '26, revenues were $14.5 billion, exceeding our expectations and representing an operational increase of 2%. Excluding our COVID products, the underlying business delivered approximately 7% operational revenue growth […] Our launch and acquired products delivered $3.1 billion in the first quarter revenues and grew by approximately 22% operationally. […] We continue to invest behind these product groups to support their growth, which we expect will enable the company to partially offset upcoming LOE headwinds over the next several years.
p. 3 · Read in context →
Why a clear beat didn't lift the guide: Denton won't raise after Q1, citing COVID's back-half seasonality as the reason to hold.
Christopher Schott (JPMorgan); David Denton (CFO): I know you typically don't raise guidance with 1Q, but this seems like a very solid start to the year from a revenue perspective. […] As you well know, Chris, I have a philosophy of not adjusting guidance in Q1. If you look at our COVID franchise, it will always be back-half weighted because of the seasonality. So we have, if anything, de-risked delivery on that without raising guidance. So absent COVID seasonality, we might be raising guidance.
p. 6 · Read in context →
Q4 & Full-Year 2025 Earnings Call — Q4 2025
The clearest single view of the repositioning: the four priorities, the obesity bet, and how 2025's cash was allocated. · Open the full transcript →
The strategic frame for the cliff years: Seagen, Metsera and Biohaven as the offset, and obesity aimed at a ~$150bn market.
Albert Bourla (Chairman and CEO): 2026 is an important year in a pivotal investment period as we strive for industry-leading growth after several key products lose patent or regulatory exclusivity in the next few years. Seagen, Metsera, and Biohaven are the most significant strategic acquisitions in recent years. They have transformative potential for Pfizer Inc. […] The foundation of our strategy in obesity and adjacent conditions is targeting breakthrough medicines in what could be a $150 billion market.
p. 1 · Read in context →
FY2025 scorecard: $62.6bn revenue (-2% op, +6% ex-COVID) and $10.2bn of launched/acquired products growing 14% to backfill LOEs.
Dave Denton (CFO): For the full year 2025, we recorded revenues of $62.6 billion versus $63.6 billion last year, representing a 2% operational decline. Importantly, our operational revenue growth, when excluding contributions from our COVID-19 products, was 6%. […] Pfizer Inc.'s recently launched and acquired set of products delivered $10.2 billion in revenues for the full year of 2025 while growing approximately 14% operationally versus last year.
p. 4 · Read in context →
Where the cash went in 2025: $9.8bn dividend, $10.4bn internal R&D, $8.8bn of BD (mostly Metsera) — dividend first, buybacks later.
Dave Denton (CFO): In 2025, we returned $9.8 billion to shareholders via the quarterly dividend, invested $10.4 billion in internal R&D, and invested approximately $8.8 billion in business development transactions, primarily reflecting the Metsera acquisition and the 3S Bio licensing deal.
p. 6 · Read in context →
The obesity economics few discuss: ~40% of the $150bn market is ex-US, much of it cash-pay at $250-350, enabling faster launches.
Alexandre de Germay (President, International Developed Markets): What's really interesting in this category is actually the size of the market ex-US projected to be $150 billion, and 40% of that is actually ex-US. […] we see that there is high willingness to pay out of pocket across all mature markets, either in Europe or Australia or in Canada, and we see the price point being across $250 to $350, which is higher than what we had expected.
p. 7 · Read in context →
Q3 2023 Earnings Call — Q3 2023
The credibility test: management quantifies the COVID collapse and lays out the cost-cut-and-acquire response that defines today's Pfizer. · Open the full transcript →
The COVID unwind laid bare: the US returns 7.9m Paxlovid courses for $4.2bn of future revenue with no cash — the shock behind the reset.
Dave Denton (CFO): Before I review this quarter's results, I will address a couple of topics that have been top of mind with investors since our announcement on October 13. These topics relate to our future U.S. government Paxlovid revenue forecasts, as well as our multiyear cost realignment program. […] As a result of all of that, Pfizer has an obligation to deliver an estimated 8.9 million treatment courses for which we will record an approximately $4.2 billion of revenue beginning in 2024 as we deliver treatment courses. It is important to note that there is no cash compensation for the estimated 8.9 million treatment courses delivered.
p. 7 · Read in context →
Funding the pivot while cutting: $43bn committed to Seagen even as costs are slashed; buybacks wait until the balance sheet delevers.
Dave Denton (CFO): In the first nine months of 2023, we invested $7.9 billion in internal R&D, returned $6.9 billion to shareholders via our quarterly dividend, and allocated approximately $43 billion toward the proposed Seagen acquisition. […] And as we delever, we anticipate returning to a more balanced capital allocation strategy, inclusive of share repurchases.
p. 9 · Read in context →
Q4 2021 Earnings Call — Q4 2021
The peak call that set everything in motion: the $100bn COVID windfall and the plan to spend it on becoming a growth company. · Open the full transcript →
The peak, in management's words: a first-ever $100bn revenue midpoint for 2022 and a claim the COVID work changed the company for good.
Albert Bourla (Chairman and CEO): Our success in leading the fight against COVID-19 have not only made a positive difference in the world. I believe they have fundamentally changed our company and our culture forever. […] Our full year 2022 financial guidance, for example, includes, for the first time ever, a forecasted revenue midpoint, that it is triple-digit, $100 billion, and an adjusted diluted EPS midpoint of $6.45.
p. 4 · Read in context →
The playbook that defined the next five years: redeploy COVID cash into BD to stay a growth company, targeting +$25bn of 2030 revenue.
Albert Bourla (Chairman and CEO): Our goal is to continue to be a growth company from '25 to 2030, despite the impact of LOEs expected during that period. […] The strength of our balance sheet and cash flows allow us to pursue new business development opportunities going forward that could add at least $25 billion of risk-adjusted revenues to our 2030 top-line expectations.
p. 7 · Read in context →
The seeds, named early: Trillium, Biohaven (now Nurtec) and Arena (etrasimod) — deals that became today's growth portfolio.
Albert Bourla (Chairman and CEO): The acquisition of Trillium builds on our strong track record of leadership in oncology, enhancing our hematology portfolio […] Our strategic collaboration with Biohaven leverages our leading commercial capabilities in pain and women's health, with Biohaven's groundbreaking oral CGRP receptor antagonist […] And through our proposed acquisition of Arena, we plan to leverage Pfizer's leading research and global development capabilities to accelerate the clinical development of etrasimod
p. 10 · Read in context →
More calls
Q3 2025 Earnings Call — Q3 2025 · 12 pages · Where the Metsera obesity acquisition was won over Novo Nordisk's counterbid, and where the US MFN drug-pricing/tariff framework was settled with a grace period. · Open →
Q2 2025 Earnings Call — Q2 2025 · 16 pages · The tariff and Most-Favored-Nation pricing scare at its peak — the July 2025 policy letters and how management framed the Section 232 risk. · Open →
Q1 2025 Earnings Call — Q1 2025 · 5 pages · The obesity reset: the oral GLP-1 danuglipron was discontinued here, and the initial FY2025 guide was set before the Metsera pivot. · Open →
Q4 & Full-Year 2023 Earnings Call — Q4 2023 · 51 pages · The first full guidance of the reset era, with Seagen just closed — the reader gets the original 2024 rebuild framework. · Open →
Q1 2023 Earnings Call — Q1 2023 · 52 pages · The first earnings call after the $43bn Seagen announcement — how management first justified the oncology bet to analysts. · Open →
Q4 & Full-Year 2022 Earnings Call — Q4 2022 · 51 pages · The COVID-to-normal transition framing — 2023 set up as the year Pfizer pivoted from pandemic peak to base-business growth. · Open →
Pfizer Inc.'s annual reports contain management's most considered account of the business. These are the sections, passages and visual pages worth opening in the originals preserved in Sources.
Pfizer Inc. — FY2025 Annual Report (Form 10-K) — FY2025
The latest 10-K: how Pfizer is organized, the patent-cliff it must out-run, the 2025 results, and the landmark U.S. drug-pricing deal. · Open the full document →
Item 1. Business — p. 18 · Read the full section →
Defines what Pfizer is and how it is run — three operating segments, of which only Biopharma is reportable.
Commercial structure: three operating segments, Biopharma the only reportable one.
We manage our commercial operations through a global structure consisting of three operating segments, each led by a single manager: Biopharma, PC1 and Pfizer Ignite. Biopharma, our innovative science-based biopharmaceutical business, is engaged in the discovery, development, manufacture, marketing, sale and distribution of biopharmaceutical products worldwide. PC1 is our contract development and manufacturing organization and a leading supplier of specialty active pharmaceutical ingredients. […] Biopharma is the only reportable segment.
p. 20 · Read in context →
Item 1. Business — Patents and Other Intellectual Property Rights — p. 25 · Read the full section →
The loss-of-exclusivity dynamic that governs pharma revenue, with management's own map of when key patents expire.
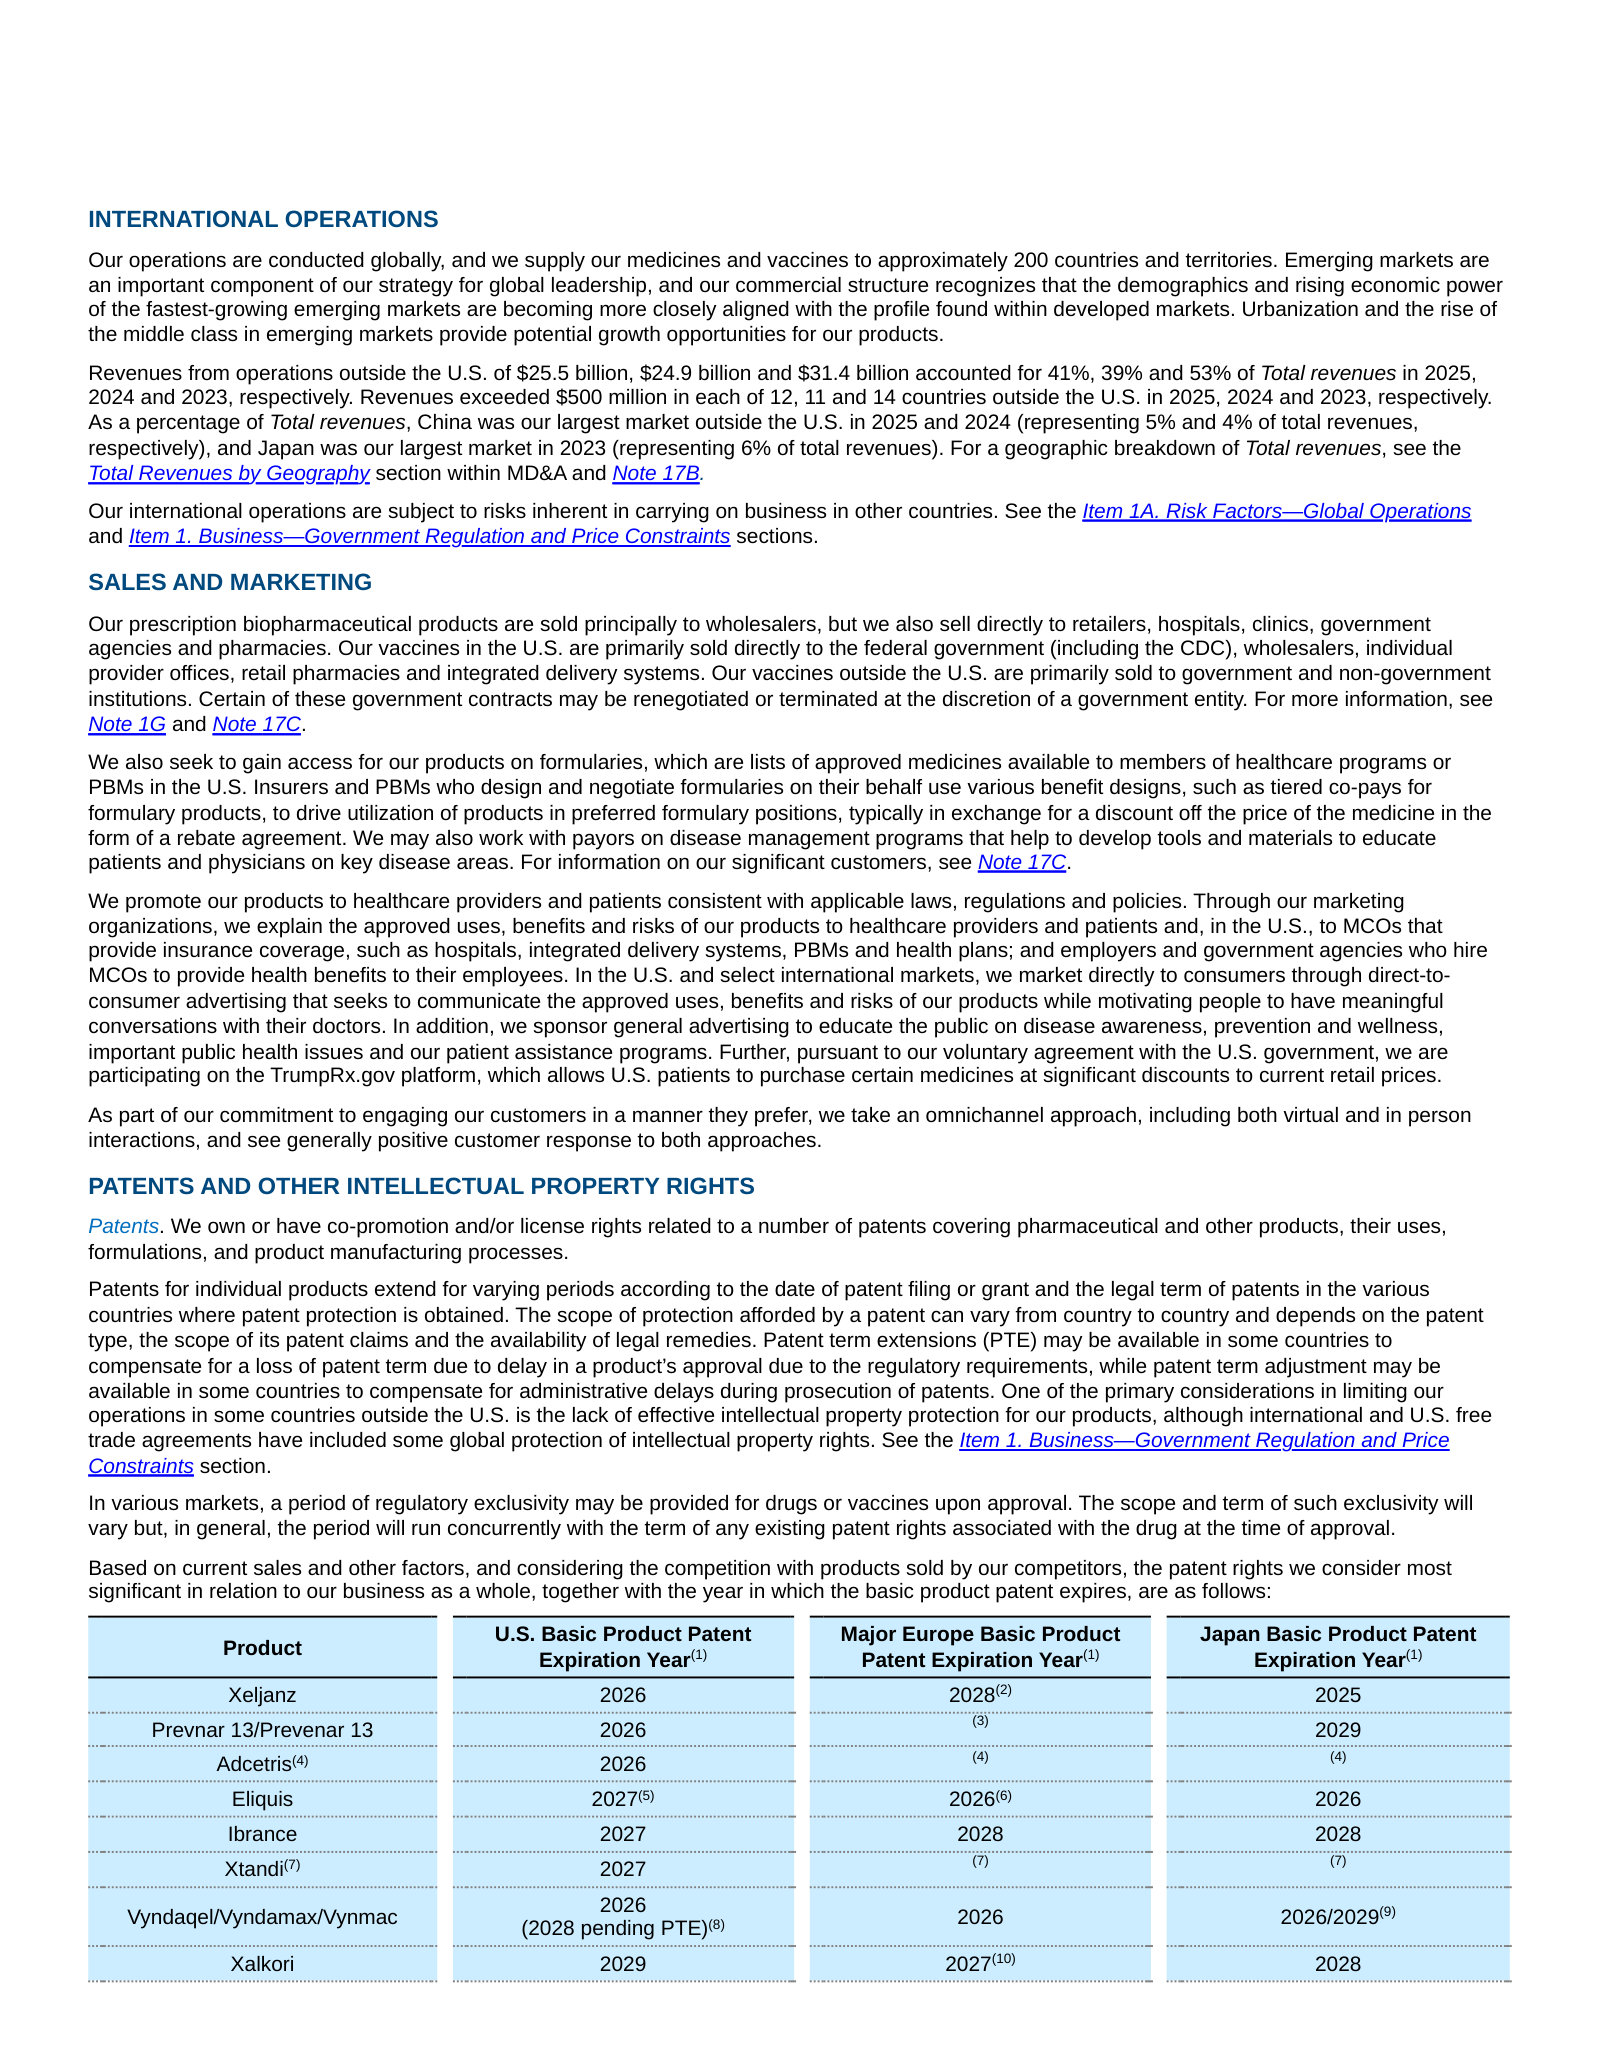
Management's warning of accelerating revenue loss from patent expiries, 2026–2030.
Once patent protection has expired or has been lost prior to the expiration date as a result of a legal challenge, we typically lose market exclusivity on these products, and generic and biosimilar pharmaceutical manufacturers generally produce identical or highly similar products and sell them for a lower price. […] We anticipate a significant reduction of revenue from patent-based or regulatory exclusivity expiries in 2026 through 2030 as several of our in-line products experience these expirations, with the rate of the reduction of revenues from patent-based or regulatory exclusivity expiries expected to significantly accelerate over the next few years.
p. 29 · Read in context →
Item 1A. Risk Factors — p. 43 · Read the full section →
The company-specific risks that could genuinely bite: revenue concentration in a dozen products and payer/policy pricing pressure.
Concentration: 12 products were 65% of revenue in 2025; Eliquis alone 13%.
We recorded revenues of more than $1 billion for each of 12 products that collectively accounted for 65% of Total revenues in 2025. For example, Eliquis accounted for 13% of Total revenues in 2025.
p. 45 · Read in context →
Pricing pressure from consolidating payers and the Inflation Reduction Act.
As the U.S. third-party payor market consolidates further, and as the IRA prices become publicly available, we may face greater pricing pressure from third-party payors, including insurers and PBMs, as they continue to drive more of their patients to use lower cost alternatives or seek even larger rebates to control costs or offset losses from the IRA and other market pressures.
p. 43 · Read in context →
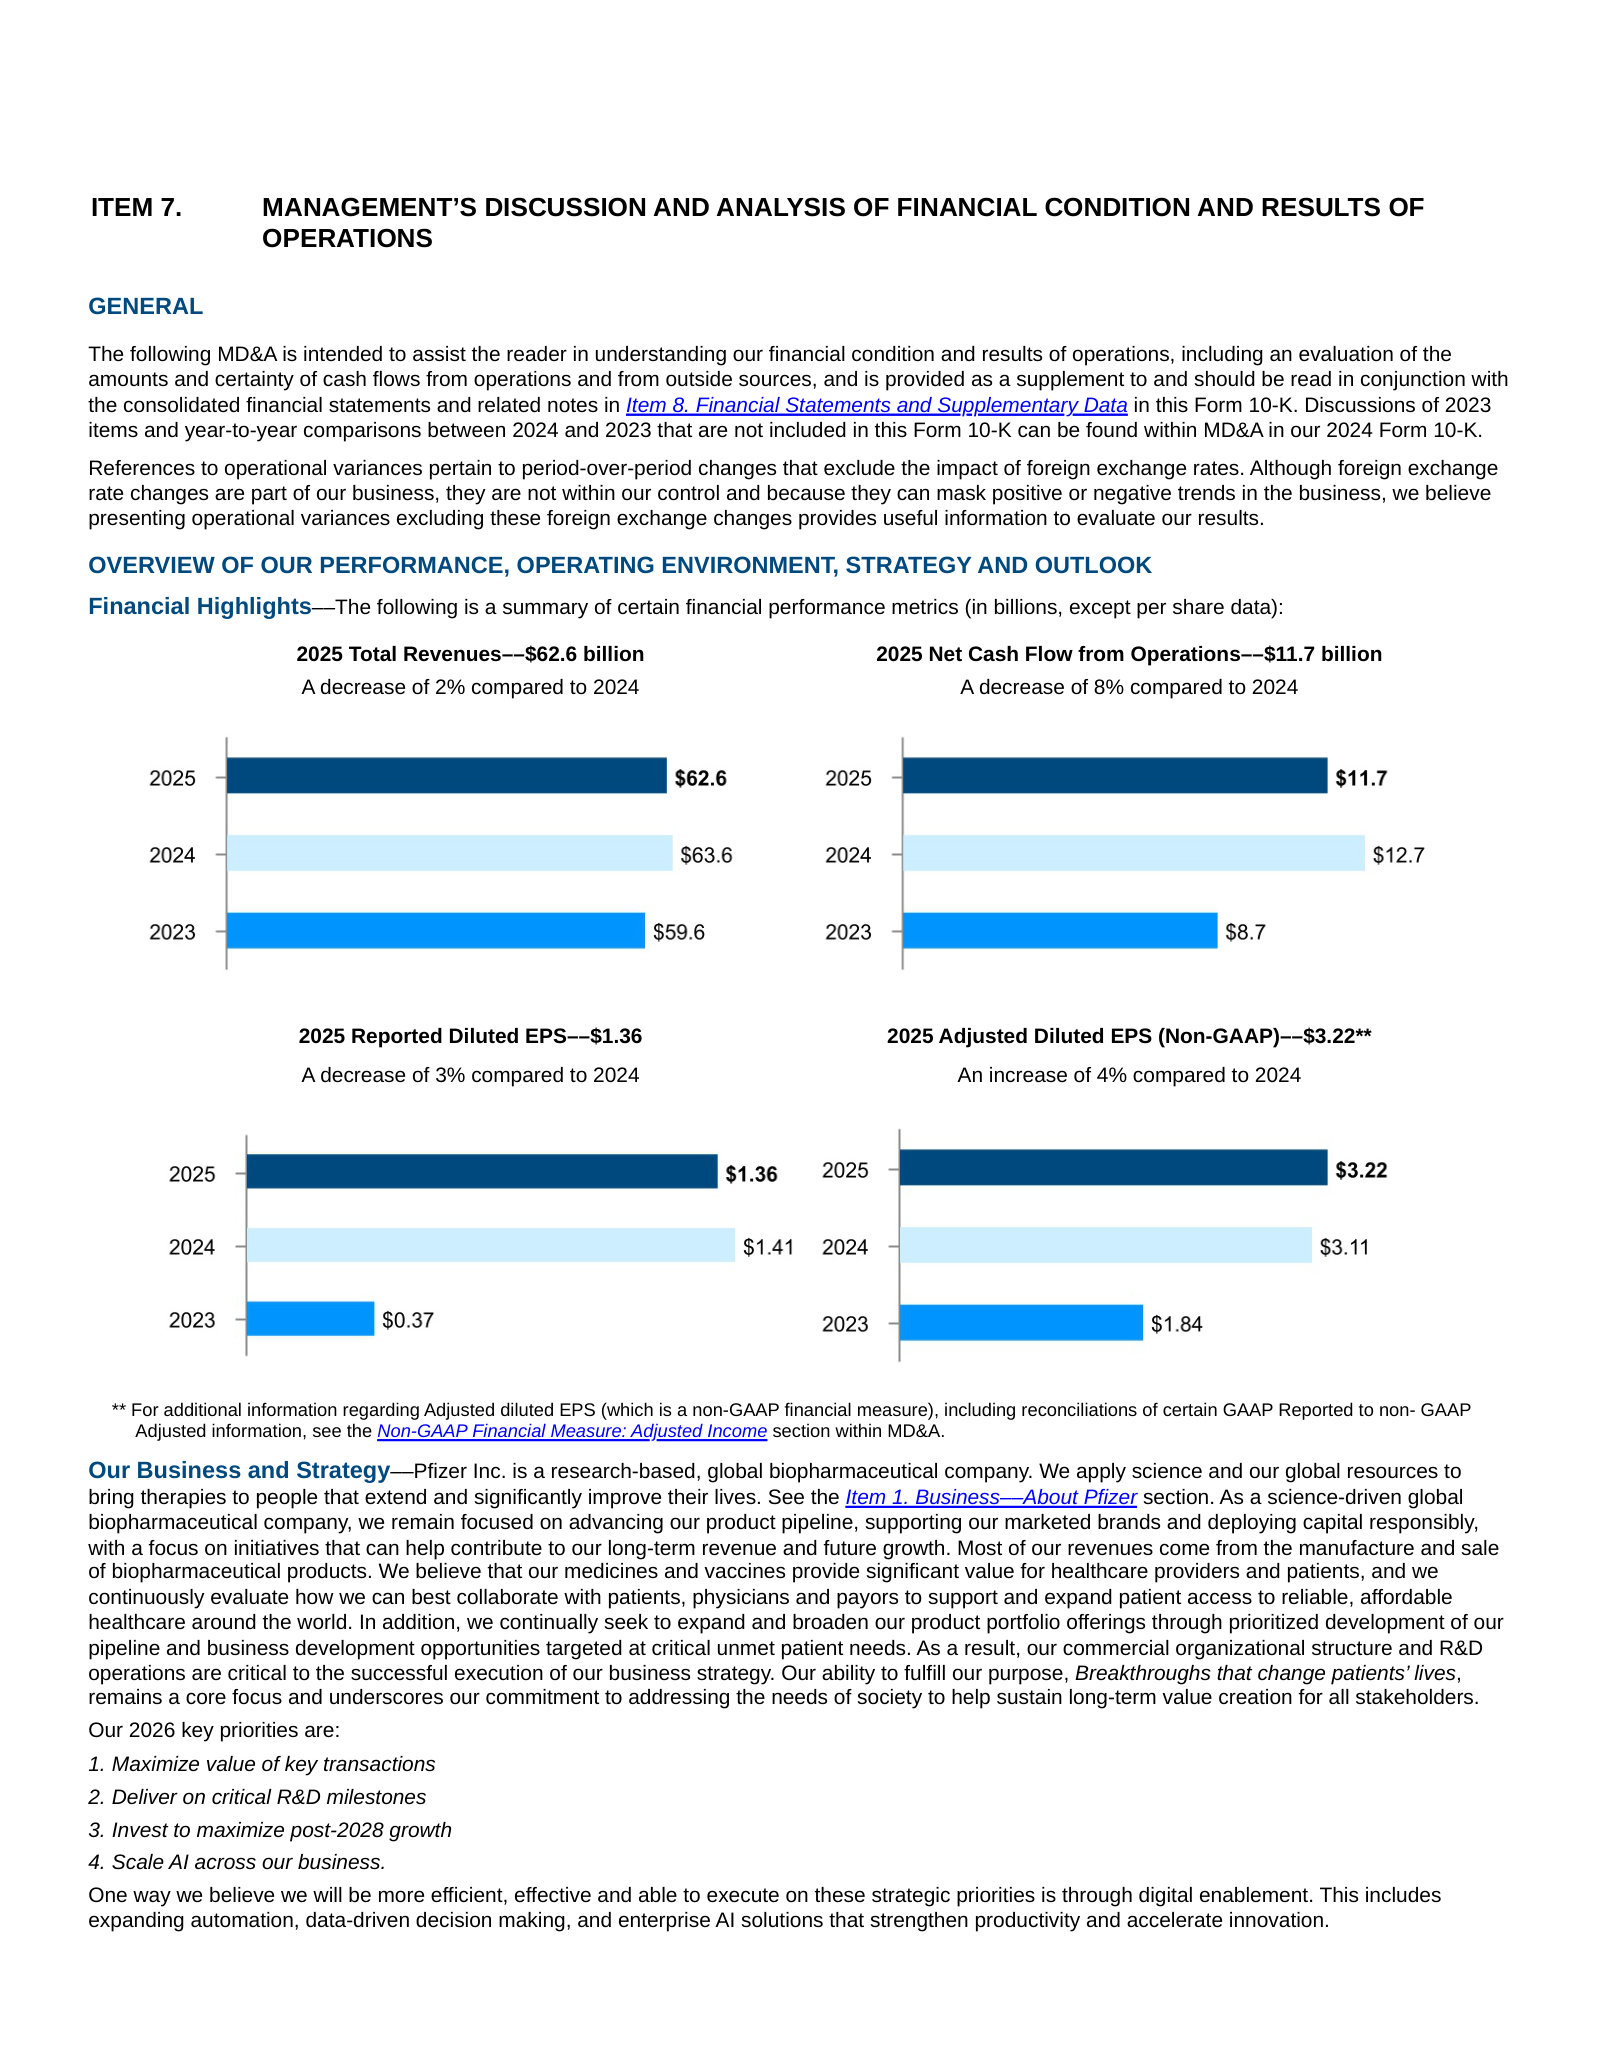
Item 7. Management's Discussion and Analysis — p. 70 · Read the full section →
Management's own account of 2025: revenue down 2%, plus the year's biggest strategic event — the U.S. government drug-pricing agreement.
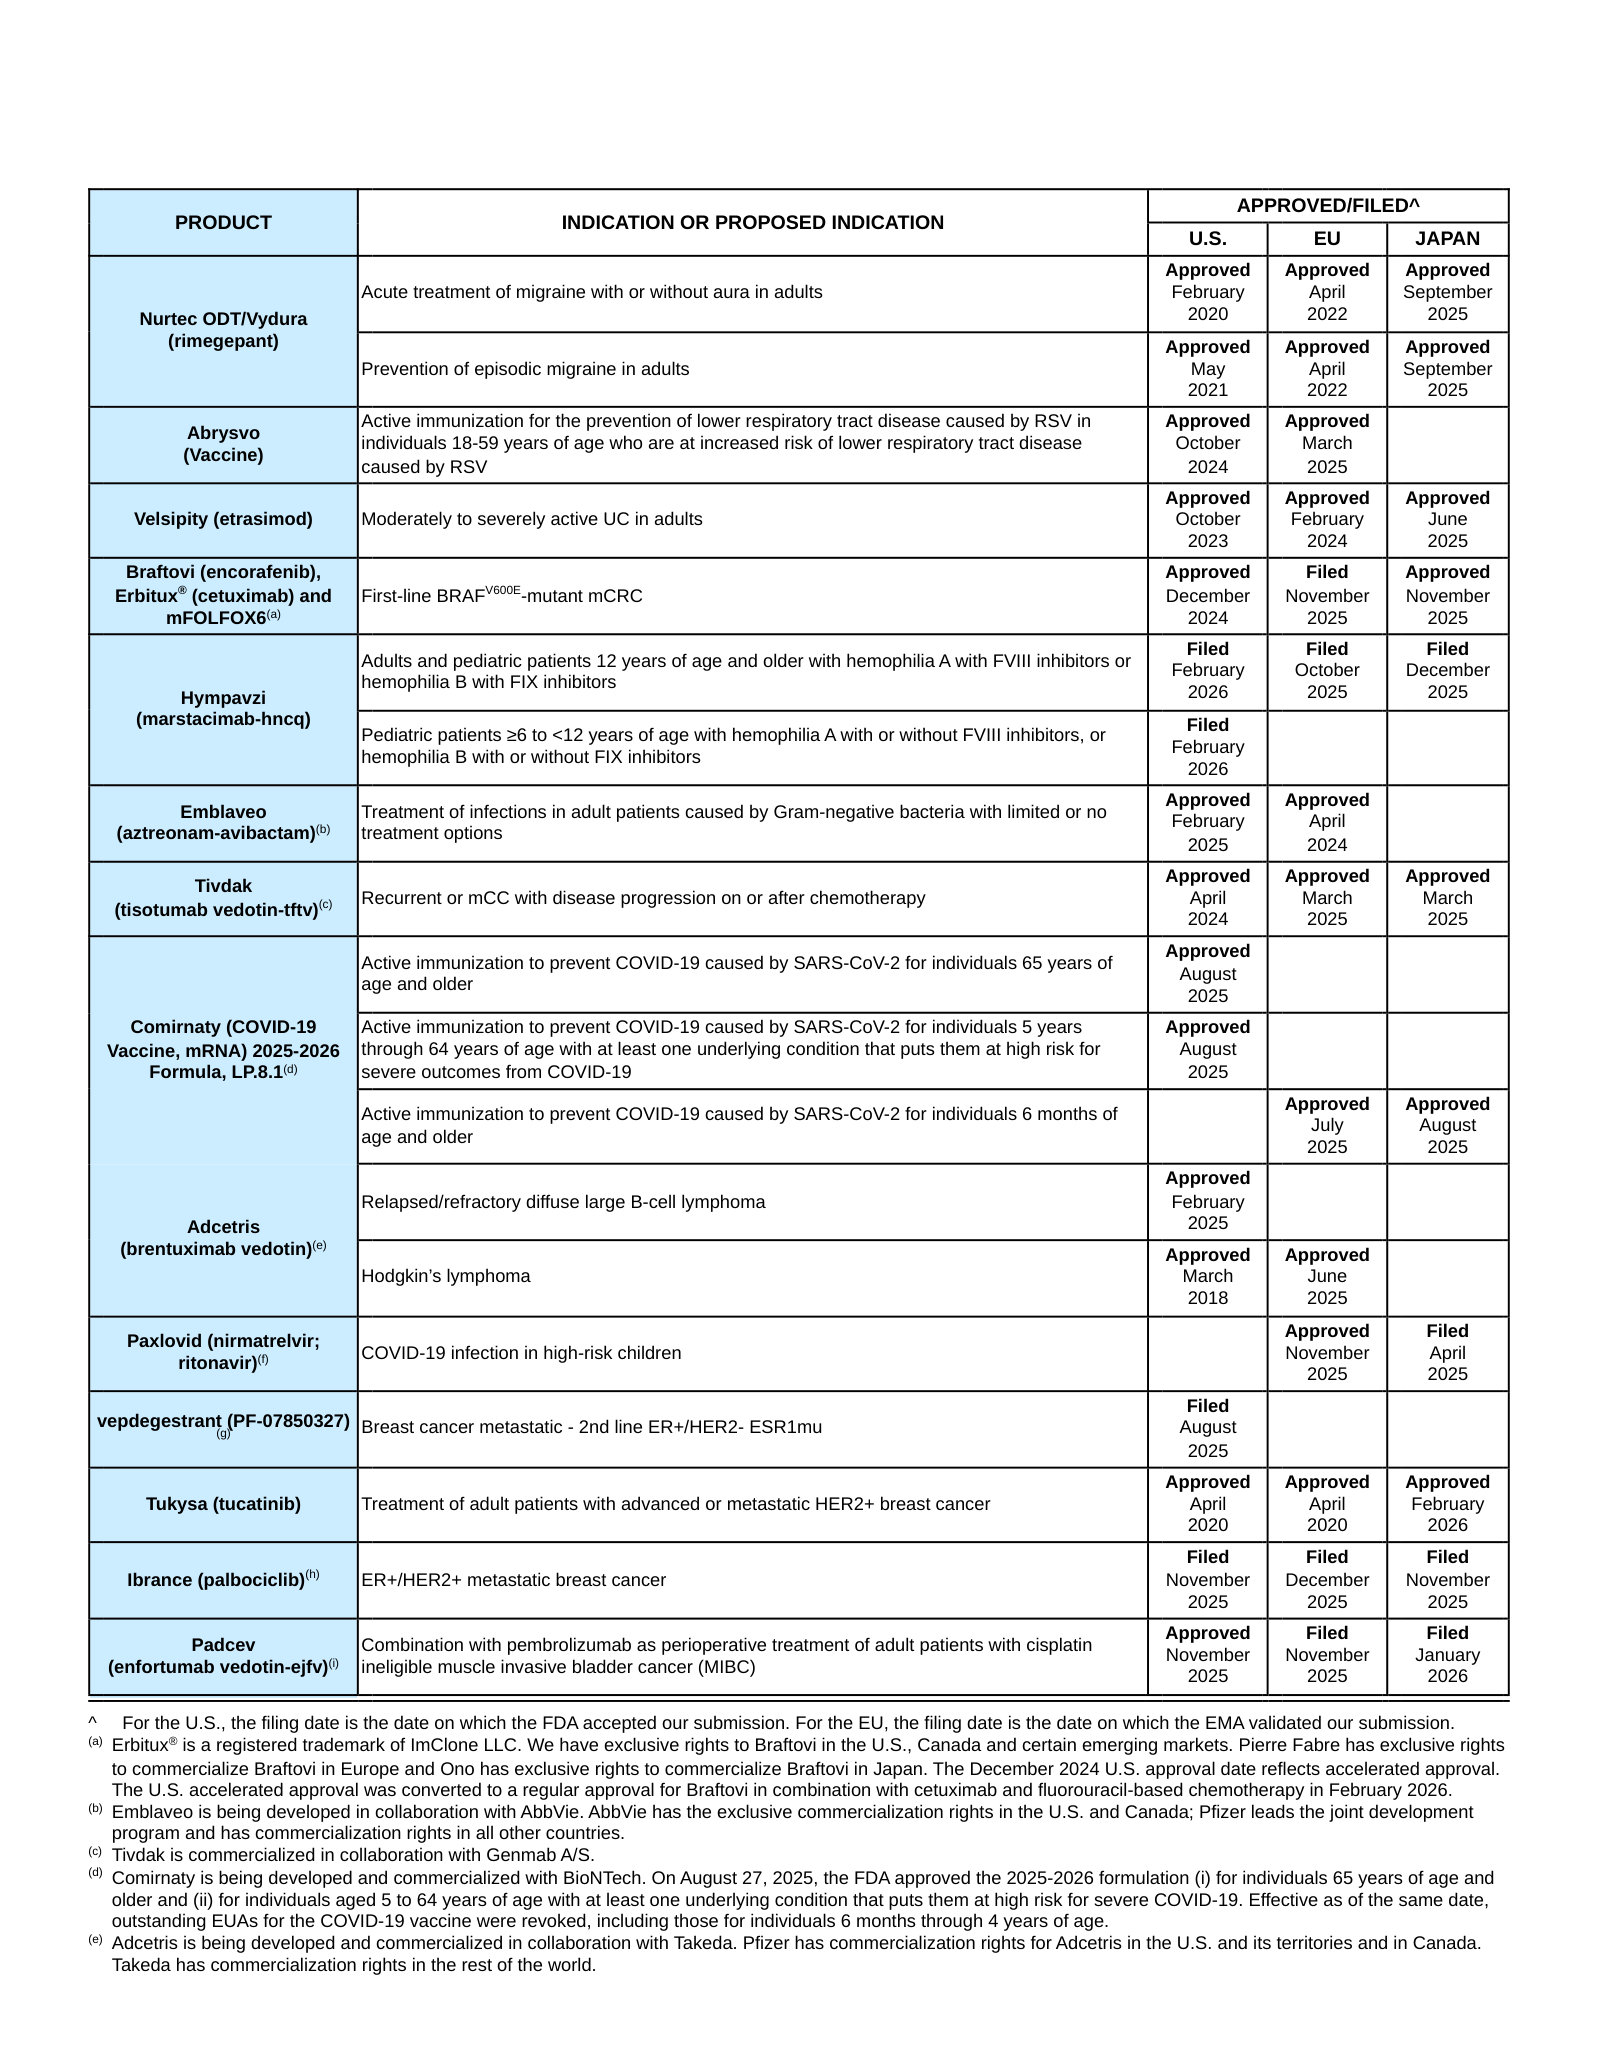
Item 7. MD&A — Product Developments — p. 90 · Read the full section →
The pipeline replenishment that must offset the patent cliff — recent approvals and filings across the U.S., EU and Japan.
Note 17. Segment, Geographic and Other Revenue Information — p. 191 · Read the full section →
How Pfizer makes money: Biopharma segment economics, revenue ex-COVID (+6% underlying), and the geographic split.
More annual reports
Pfizer Inc. — FY2024 Annual Report (Form 10-K) — FY2024 · 213 pages · Prior year: the first full year absorbing the COVID-product decline and integrating the Seagen oncology acquisition. · Open →
Pfizer Inc. — FY2023 Annual Report (Form 10-K) — FY2023 · 218 pages · The transition year: COVID revenues collapse, large inventory write-offs, and the $43B Seagen deal close. · Open →
Pfizer Inc. — FY2022 Annual Report (Form 10-K) — FY2022 · 144 pages · Peak-COVID year — record revenue from Comirnaty and Paxlovid — the baseline the later declines are measured against. · Open →
Pfizer Inc. — FY2021 Annual Report (Form 10-K) — FY2021 · 166 pages · The Comirnaty launch year that doubled revenue — the start of the COVID-era earnings bulge. · Open →
Source: S&P Capital IQ consensus via Xpressfeed · Generated 2026-07-24.
Pfizer's consensus tape pairs a steadily declining forward with a long run of upside surprises. Analysts model revenue and normalized EPS falling every year through 2029 — EPS down roughly 22% from 2026 — even as the company has beaten normalized-EPS consensus in each of the last eight quarters. Those forward estimates have barely moved over six months, so the decline reads as settled Street math rather than a fresh downgrade; ratings skew to Hold, with price targets spanning $24 to $35.
Forward estimates
Currency: USD · Scale: money in millions, absolute · YoY uses the prior fiscal year from the feed; analyst count and range use the first displayed period.
| Metric | FY2026E | FY2027E | FY2028E | FY2029E | YoY | Analysts | Low / high |
|---|---|---|---|---|---|---|---|
| Revenue | $61.75bn | $59.37bn | $54.95bn | $54.53bn | -1.3% | 25 | $59.51bn / $63.12bn |
| EPS (normalized) | $2.94 | $2.83 | $2.42 | $2.28 | -8.6% | 25 | $2.80 / $3.12 |
Normalized EPS beat consensus all eight quarters, by 4% to 73% — but the surprise is shrinking
Current sequences by metric: Revenue: 4 consecutive beats; EPS (normalized): 8 consecutive beats.
Currency: USD · Scale: money in millions, absolute · Consensus is captured before each actual first became effective.
| Quarter | Metric | Consensus | Actual | Surprise | Outcome |
|---|---|---|---|---|---|
| Q1 FY2026 | Revenue | $13.80bn | $14.45bn | +4.7% | Beat |
| Q1 FY2026 | EPS (normalized) | $0.72 | $0.75 | +3.9% | Beat |
| Q4 FY2025 | Revenue | $16.83bn | $17.56bn | +4.3% | Beat |
| Q4 FY2025 | EPS (normalized) | $0.57 | $0.66 | +16.2% | Beat |
| Q3 FY2025 | Revenue | $16.52bn | $16.65bn | +0.8% | Beat |
| Q3 FY2025 | EPS (normalized) | $0.64 | $0.87 | +37.0% | Beat |
| Q2 FY2025 | Revenue | $13.53bn | $14.65bn | +8.3% | Beat |
| Q2 FY2025 | EPS (normalized) | $0.57 | $0.78 | +35.9% | Beat |
| Q1 FY2025 | Revenue | $14.05bn | $13.71bn | -2.4% | Miss |
| Q1 FY2025 | EPS (normalized) | $0.67 | $0.92 | +36.5% | Beat |
| Q4 FY2024 | Revenue | $17.26bn | $17.76bn | +2.9% | Beat |
| Q4 FY2024 | EPS (normalized) | $0.46 | $0.63 | +37.2% | Beat |
| Q3 FY2024 | Revenue | $14.87bn | $17.70bn | +19.1% | Beat |
| Q3 FY2024 | EPS (normalized) | $0.61 | $1.06 | +73.3% | Beat |
| Q2 FY2024 | Revenue | $13.02bn | $13.28bn | +2.0% | Beat |
| Q2 FY2024 | EPS (normalized) | $0.46 | $0.60 | +30.9% | Beat |
Estimate momentum
The largest six-month change is FY2028 revenue, down about 1%.
Currency: USD · Scale: money in millions, absolute · Point-in-time consensus; Δ90d is Now versus 90d.
| Metric | FY | 180d | 90d | 30d | Now | Δ90d |
|---|---|---|---|---|---|---|
| Revenue | FY2027 | $58.97bn | $58.69bn | $59.32bn | $59.37bn | +1.2% |
| Revenue | FY2028 | $55.53bn | $54.84bn | $55.36bn | $54.94bn | +0.2% |
| EPS (normalized) | FY2027 | $2.85 | $2.82 | $2.83 | $2.83 | +0.5% |
| EPS (normalized) | FY2028 | $2.44 | $2.40 | $2.41 | $2.42 | +0.9% |
Widest disagreement is on 2027 GAAP profit and 2028 profitability, not the top line
2027 GAAP net income spans $5.7bn–$13.6bn across 8 analysts; 2028 EBITDA and normalized EPS ranges are also wide, while revenue estimates cluster tightly.
Currency: USD · Scale: money in millions, absolute · Spread/mean is absolute high-low divided by absolute mean.
| Metric | Period | Mean | Low–high | Spread/mean | Analysts |
|---|---|---|---|---|---|
| Net income (GAAP) | FY2027E | $10.27bn | $5.72bn–$13.55bn | 76.2% | 8 |
| EBITDA | FY2028E | $20.54bn | $17.54bn–$24.99bn | 36.2% | 10 |
| EPS (normalized) | FY2028E | $2.42 | $2.07–$2.97 | 37.2% | 19 |
Ratings skew to Hold — 16 of 28 — with targets from $24 to $35
Ten Buy/Outperform ratings offset two bearish; the mean target is about $29 across 26 estimates.
Currency: USD · Scale: money in millions, absolute · Analyst counts shown explicitly.
| Street view | Reading | Analysts |
|---|---|---|
| Recommendation mix | Buy 8, Outperform 2, Hold 16, Underperform 1, Sell 1 | 28 |
| Consensus score | 2.46 | 28 |
| Target price | mean $28.75; median $28.00; high $35.46; low $24.00 | 26 |
Outer-year coverage thins sharply — treat 2029 as indicative
FY2029 EBITDA carries a single estimate and GAAP net income and EPS just three each; free cash flow and net debt are means only, with no ranges.
Visible Alpha broker models via S&P Xpressfeed · 20 brokers · 2076 line items · freshest revision 2026-07-20.
The Street models Pfizer's revenue essentially flat in FY-2026 (~$61.8B) before a mid-single-digit decline — roughly $59.5B in FY-2027 and $54.8B in FY-2028 — as Eliquis, Ibrance and other franchises lose exclusivity. An oncology ramp led by Padcev and a small-but-rising pipeline are the modeled offsets; the total-revenue consensus is tight even as brokers disagree sharply on the mix.
Loss-of-exclusivity is the story: Eliquis, Ibrance and Xtandi all roll off
| Line | FY-2025A | FY-2026E | FY-2027E | FY-2028E | YoY | Brokers |
|---|---|---|---|---|---|---|
| LOE cliff | — | — | — | — | — | — |
| Eliquis alliance revenue - IH | $7.99bn | $8.33bn | $7.09bn | $3.66bn | +4.3% | 20 |
| Ibrance | $4.10bn | $3.85bn | $2.90bn | $1.56bn | -6.0% | 20 |
| Xtandi | $2.21bn | $2.01bn | $1.31bn | $586.35m | -9.0% | 20 |
| Xeljanz | $1.04bn | $710.46m | $475.49m | $333.75m | -31.4% | 20 |
| COVID | — | — | — | — | — | — |
| Comirnaty | $4.01bn | $3.19bn | $2.98bn | $2.73bn | -20.5% | 20 |
| Paxlovid | $2.66bn | $1.26bn | $1.20bn | $1.13bn | -52.5% | 20 |
Padcev leads the offset; Nurtec and Abrysvo build while Vyndaqel plateaus
| Line | FY-2025A | FY-2026E | FY-2027E | FY-2028E | YoY | Brokers |
|---|---|---|---|---|---|---|
| Growth | — | — | — | — | — | — |
| Padcev | $1.98bn | $2.50bn | $2.95bn | $3.39bn | +26.5% | 20 |
| Nurtec ODT | $1.47bn | $1.71bn | $1.93bn | $2.13bn | +16.3% | 20 |
| Abrysvo | $769.80m | $1.03bn | $1.11bn | $1.23bn | +33.8% | 20 |
| Plateau | — | — | — | — | — | — |
| Vyndaqel | $6.41bn | $6.75bn | $6.57bn | $6.19bn | +5.3% | 20 |
The pipeline is the swing factor — near-zero today, ~$1.3B modeled by FY-2028
Modeled total pipeline revenue rises from essentially nothing in FY-2025 to a ~$1.3B median by FY-2028, but the range runs from $0 to ~$4.4B. It is the single least-settled line in the set and the swing factor for whether the top line stabilizes.
Where broker models disagree
| Line | Period | Median | Q1–Q3 | Min–max | Brokers |
|---|---|---|---|---|---|
| Total pipeline revenue | FY-2028E | $1.29bn | $885.30m–$2.33bn | $0.00–$4.41bn | 20 |
| Vyndaqel | FY-2028E | $6.07bn | $5.64bn–$6.71bn | $5.20bn–$7.54bn | 20 |
| Eliquis alliance revenue - IH | FY-2028E | $3.62bn | $3.34bn–$3.86bn | $2.30bn–$5.32bn | 20 |
| Ibrance | FY-2028E | $1.58bn | $1.30bn–$1.69bn | $871.27m–$2.55bn | 20 |
Coverage is deep and fresh on the base, but the pipeline lines thin out
Most product lines carry 18–20 brokers with revisions into July 2026, so the revenue base is well covered. The pipeline and new-product lines that determine the offset to the cliff fall to a handful of brokers — and near zero in FY-2025–26 — so those forecasts are thinner than the headline coverage implies.
Headline P&L consensus, momentum and beat/miss live in the CapIQ tab.
Source: S&P Capital IQ transcripts via Xpressfeed · latest indexed call 2026-05-05 · generated 2026-07-24.
Latest call digest
Pfizer Inc., Q1 2026 Earnings Call, May 05, 2026 · 2026-05-05T14:00:00
Q1 2026 call — May 5, 2026. Pfizer opened the year ahead of its own plan: revenues of $14.5 billion (+2% operationally, ~7% ex-COVID), reported EPS of $0.47 and adjusted EPS of $0.75, both above expectations. Management framed the quarter around two legal developments rather than the print itself — the Vyndamax (tafamidis) patent settlement pushing that LOE out roughly 2.5 years to mid-2031, and a Belgian court ruling on the EU Comirnaty contracts. Together these underpin a restated claim of a high single-digit five-year revenue CAGR beginning in 2029 and improved post-2028 cash flow. Prepared remarks leaned heavily on the oncology pipeline (Padcev EV-304 in muscle-invasive bladder cancer, Elrexfio MagnetisMM-5, atirmociclib), the newly closed Metsera obesity platform, a first-disclosed 35-serotype next-gen adult pneumococcal candidate, and AI across R&D and commercial.
The Q&A reality was more skeptical. Despite the beat, CFO Dave Denton declined to raise full-year guidance, invoking his standard practice of not adjusting after Q1 and the back-half weighting of COVID — conceding that 'absent that, we probably would be raising guidance.' Analysts pressed hardest on capital allocation: whether the Vyndamax clarity opens the door to larger M&A (and what that means for the dividend), when buybacks return, and how the pipeline bridges the stacked 2026-2028 LOEs. Management held the line that the dividend is preserved, that share repurchase moves 'back into greater consideration' but is not imminent, and that a transformative merger is 'not right now very high in our list.' Guidance was reaffirmed, not raised.
Participant coverage from the latest call.
| Group | Participants | Count |
|---|---|---|
| Management | Operator; Francesca DeMartino — Chief Investor Relations Officer, Pfizer Inc.; Albert Bourla — Chairman of the Board & CEO, Pfizer Inc.; David Denton — Executive VP & CFO, Pfizer Inc.; Chris Boshoff — Chief Scientific Officer and President of Research & Development, Pfizer Inc.; Alexandre de Germay — Executive VP & Chief International Commercial Officer, Pfizer Inc.; Aamir Malik — Executive VP & Chief U.S. Commercial Officer, Pfizer Inc. | 7 |
| Analysts | Vamil Divan — MD of Healthcare Research & Senior Equity Research Analyst, Guggenheim Securities, LLC, Research Division; David Risinger — Senior Research Analyst & Senior MD of Biopharma, Leerink Partners LLC, Research Division; Christopher Schott — Senior Analyst, JPMorgan Chase & Co, Research Division; Kerry Holford — Analyst, Joh. Berenberg, Gossler & Co. KG, Research Division; Umer Raffat — Senior MD & Senior Analyst of Equity Research, Evercore ISI Institutional Equities, Research Division; Asad Haider — MD & Senior Healthcare Strategist, Goldman Sachs Group, Inc., Research Division; Evan Seigerman — MD & Senior BioPharma Research Analyst, BMO Capital Markets Equity Research; Courtney Breen — Senior Research Analyst, Bernstein Institutional Services LLC, Research Division; Louise Chen — Research Analyst, Scotiabank Global Banking and Markets, Research Division | 9 |
Curated latest-call exchanges; one row per analyst topic.
| Analyst | Firm | Topic | What changed in Q&A |
|---|---|---|---|
| Chris Schott | JPMorgan | Guidance not raised; BD appetite | Asked why a strong start did not lift guidance and whether Vyndamax clarity enables larger deals; Denton cited COVID back-half seasonality and said absent that they would be raising, and kept BD framed around $7B capacity. |
| Umer Raffat | Evercore ISI | Dividend integrity vs transformative M&A | Probed the odds of a large, dividend-threatening deal and how Bourla and the Board view his tenure and dividend continuity; Bourla said a mega-merger is not a near-term priority given the AI-transformation focus. |
| Asad Haider | Goldman Sachs | Bridging the LOE gap to 2029 growth | Pressed on levers to hit high single-digit CAGR against stacked LOEs and base-business assumptions; Bourla leaned on risk-adjusted pipeline breadth and launched/acquired products growing 22%. |
| Evan Seigerman | BMO Capital Markets | Share repurchases | Asked what else is needed to start buying back stock at current levels; Denton said repurchases move back into greater consideration but the current priority remains R&D and BD investment. |
| Kerry Holford | Berenberg | Comirnaty ex-US and Belgian ruling | Asked about EU vaccination rates and the read-through of the April 2026 Belgian judgment; management said the Q1 Comirnaty decline reflected a lapsed UK contract, not vaccination trends, and work has begun with Poland and Romania to execute the ruling. |
| David Risinger | Leerink Partners | Oncology readouts and org restructuring | Asked about SV and mevrometostat pivotal readouts and the reorganization of BD and strategy; Bourla detailed moving BD under R&D and executive-team reductions, Boshoff framed the mid-year oncology readouts. |
| Vamil Divan | Guggenheim Securities | ADA obesity data expectations | Asked what Pfizer will present at ADA; Boshoff detailed VESPER-1/2/3 disclosures and said amylin monotherapy data comes in the second half. |
| Courtney Breen | Bernstein | Sigvotatug vedotin frontline positioning | Asked how the planned first-line all-comers SV study is positioned versus Symbiotic-Lung-01; Boshoff pointed to the PD-L1-high combination signal and mid-year second-line readout. |
Theme tracker
Themes are curator-classified across supplied calls.
| Theme | Status | Quarters mentioned | Read-through |
|---|---|---|---|
| COVID revenue decline and guidance derisking | persisted | Q2 2023, Q3 2023, Q4 2023, Q2 2025, Q3 2025, Q4 2025, Q1 2026 | COVID has been the dominant swing factor across the entire window — from the 2023 credibility episode through repeated 'derisking' of back-half seasonality. By Q1 2026 it is a smaller, ex-COVID ~7% growth story, but management still cites COVID seasonality as the reason not to raise. |
| Cost realignment and productivity savings | persisted | Q3 2023, Q4 2023, Q3 2024, Q4 2024, Q1 2025, Q2 2025, Q3 2025, Q4 2025, Q1 2026 | The savings target has been steadily enlarged — $3.5B launched in Q3 2023, then $4B, $4.5B, and by 2025 an aggregate ~$7.2B net cost target plus a separate $1.5B manufacturing program. A consistent, on-track message every quarter. |
| LOE cliff (2026-2028) and post-2028 CAGR | persisted | Q4 2024, Q1 2025, Q3 2025, Q4 2025, Q1 2026 | The patent-cliff transition is the central strategic frame. The Q1 2026 Vyndamax settlement materially reshaped it, extending a $6B+ product and letting management restate a high single-digit five-year CAGR from 2029. |
| Obesity / metabolic strategy | emerged | Q1 2025, Q3 2025, Q4 2025, Q1 2026 | Moved from setback to centerpiece: danuglipron was discontinued in Q1 2025, then the ~$4.9B Metsera acquisition (announced Q3 2025, contested by Novo, closed by Q4 2025) made obesity a lead growth pillar, with VESPER data and a China GLP-1 launch by Q1 2026. |
| Oncology / Seagen ADC platform | persisted | Q2 2024, Q4 2025, Q1 2026 | Consistently positioned as the most advanced growth engine; roughly half of 2026 key readouts are oncology. Candor has crept in — management conceded on the Q4 2025 call that no ADC has beaten docetaxel in second-line lung, a readout still pending. |
| Capital allocation, BD discipline and the dividend | persisted | Q3 2024, Q4 2024, Q1 2025, Q4 2025, Q1 2026 | Sharpened by Starboard's involvement in late 2024, this recurs as questions on BD capacity (which swung from ~$13B to ~$7B post-Metsera), buyback timing and dividend safety. Management's answer is unchanged: dividend preserved, buybacks deferred, tuck-in-biased BD. |
| Trade, tariffs and MFN drug pricing | emerged | Q1 2025, Q2 2025, Q3 2025 | Policy risk dominated the 2025 calls — the Section 232 probe, the July 2025 Trump MFN letter, and a US-government agreement with a three-year tariff grace period reached in Q3 2025. It receded from the Q4 2025 and Q1 2026 discussions once a deal framework was in place. |
| AI across R&D, commercial and manufacturing | emerged | Q4 2025, Q1 2026 | A newer emphasis: Q4 2025 disclosed scaling to more than 1,200 GPUs, and Q1 2026 elevated AI to a headline strategic priority for compressing R&D timelines. |
Guidance ledger
Quotes, calls, and speakers are source-verified; outcomes are curator-classified.
| Verbatim guidance | Call | Speaker | Curator outcome | Outcome note |
|---|---|---|---|---|
| “We continue to expect total company revenues in the range of $59.5 billion to $62.5 billion, and adjusted diluted earnings per share in the range of $2.80 to $3 a share.” | Pfizer Inc., Q1 2026 Earnings Call, May 05, 2026 · 2026-05-05T14:00:00 | David Denton | pending | FY2026 guidance reaffirmed, not raised, despite a Q1 beat; full-year result not yet in the supplied call history. |
| “We expect total company full year '26 revenues to be in the range of $59.5 billion to $62.5 billion and full year '26 adjusted diluted earnings per share to be in the range of $2.80 to $3 a share” | Pfizer Inc., Q4 2025 Earnings Call, Feb 03, 2026 · 2026-02-03T15:00:00 | David Denton | pending | Initial FY2026 guide, set alongside a FY2025 result of $62.6B revenue and $3.22 adjusted EPS; 2026 outcome not yet in the supplied history. |
| “we are raising and narrowing our full year 2025 adjusted diluted earnings per share guidance by approximately $0.08 at the midpoint to $3 a share to $3.15 a share.” | Pfizer Inc., Q3 2025 Earnings Call, Nov 04, 2025 · 2025-11-04T15:00:00 | David Denton | kept | FY2025 adjusted EPS finished at $3.22 per the Q4 2025 call, above this raised range. |
| “our revised full year '25 adjusted diluted earnings per share range is now $2.90 to $3.10 a share.” | Pfizer Inc., Q2 2025 Earnings Call, Aug 05, 2025 · 2025-08-05T14:00:00 | David Denton | kept | FY2025 adjusted EPS of $3.22 exceeded this mid-year raised range. |
| “We expect total company full year 2025 revenues to be in the range of $61 billion to $64 billion and full year 2025 adjusted diluted earnings per share to be in the range of $2.80 to $3 a share” | Pfizer Inc., Q1 2025 Earnings Call, Apr 29, 2025 · 2025-04-29T14:00:00 | David Denton | kept | FY2025 landed at $62.6B revenue (within range) and $3.22 adjusted EPS (above the initial range). |
| “We now expect revenues in the range of $61 billion to $64 billion” | Pfizer Inc., Q3 2024 Earnings Call, Oct 29, 2024 · 2024-10-29T14:00:00 | David Denton | kept | Raised FY2024 revenue guide; the year closed at $63.6B, within the range. |
| “we expect adjusted diluted earnings per share of $2.45 to $2.65” | Pfizer Inc., Q2 2024 Earnings Call, Jul 30, 2024 · 2024-07-30T14:30:00 | David Denton | kept | Raised FY2024 adjusted EPS guide; the year finished at $3.11, well above after subsequent raises. |
Q&A pressure map
Question counts and firms are curator tallies; analyst coverage shown above.
| Topic | Questions | Firms | Pressure / response |
|---|---|---|---|
| COVID revenue trajectory and back-half derisking | 6 | Evercore ISI, Wells Fargo, Wolfe Research, Berenberg, TD Cowen | The most persistent line of questioning across the window. After the 2023 miss, analysts repeatedly tested how much COVID risk was baked into guidance; management's stock answer became that COVID is 'derisked' and seasonally back-half weighted. |
| Capital allocation, BD capacity and dividend safety | 5 | UBS, JPMorgan, Evercore ISI, BMO Capital Markets, Citi | Intensified by Starboard in late 2024 and again on the Q1 2026 call; analysts push on buyback timing, deal size and dividend durability, and management consistently defers buybacks while affirming the dividend. |
| Tariffs, MFN and drug-pricing policy | 5 | UBS, Cantor, TD Cowen, BofA, Jefferies | Dominated the 2025 calls. Analysts sought a quantified 2025-2026 policy impact; management repeatedly declined to size it, saying it was still under active discussion — a conservative non-answer rather than a clear evasion. |
| Obesity / Metsera program and data quality | 4 | JPMorgan, TD Cowen, Guggenheim, Leerink Partners | Skeptics questioned whether Metsera's data is differentiated versus incumbents and worth the contested acquisition; management defended diligence and monthly-dosing differentiation. |
| Oncology pipeline readouts (SV, ADC vs docetaxel) | 4 | Jefferies, Bernstein, Morgan Stanley, Leerink Partners | Analysts pressed on the second-line lung ADC bar; management conceded no ADC has yet beaten docetaxel there and pointed to a pending mid-year readout. |
Language shifts
Only language evidence verified against the referenced component is shown.
| Observation | Verbatim evidence | Call ID | Component |
|---|---|---|---|
| In 2024 management's register was defensive and credibility-focused after the COVID miss, repeatedly invoking caution. | “We know credibility is extremely important for us.” | 1875220311 | 52 |
| Dividend protection was cast in unusually emphatic terms during the post-miss period. | “The dividend is a sacred cow for us.” | 1875220311 | 57 |
| By late 2025 the tone toward competition turned combative, adopting aggressive new vocabulary around the Metsera contest. | “What they want is to catch and kill an emerging competitor” | 1961670320 | 11 |
| By Q1 2026 the language shifted to conviction about the post-cliff growth outlook, replacing hedged projections with 'clear line of sight.' | “Following the Vyndamax settlement, we now have a clear line of sight to a high single-digit 5-year revenue CAGR post-2028.” | 1991561932 | 3 |
The call history reframes Pfizer's debate from the 2023 COVID-credibility crisis to whether an enlarged pipeline and the Vyndamax reprieve can bridge the 2026-2028 patent cliff to renewed growth from 2029. Management has delivered on the beat-and-raise cadence it set for 2024-2025, which lends some weight to its post-2028 confidence, but the recurring, unresolved analyst pressure on buybacks, deal size and dividend durability signals the market is not yet taking that bridge for granted.
Competitors describe Pfizer Inc.'s market in their own filings and calls. These verified passages and visual pages show where their strategies meet, using source documents preserved in Sources.
Moderna, Inc. (MRNA)
Moderna is Pfizer's most direct, by-name rival: the two firms are the leading mRNA COVID-19 vaccine competitors (Spikevax vs. Comirnaty), now also collide in adult RSV vaccines, and are locked in cross-border mRNA patent litigation. Moderna's 10-K names Pfizer explicitly more than any other peer here.
Moderna names Pfizer/BioNTech as its principal COVID-19 vaccine rival and Pfizer as an RSV vaccine rival that reached the U.S. market first
We largely compete against Pfizer and BioNTech for sales of our COVID vaccines, whose vaccine is also based on mRNA technology. […] With respect to our RSV vaccine, we compete against Pfizer and GlaxoSmithKline, who entered the U.S. market prior to us, and our RSV sales have been minimal to date.
p. 57 · Read in context →
Moderna says it is shut out of many European COVID-vaccine markets by a competitor's European Commission contract running to end-2026
including against Pfizer and Sanofi for sales of our COVID vaccines and Pfizer and GSK for our RSV vaccine. […] we have been excluded from selling our COVID vaccines in many European markets due to a competitor's contract with the European Commission, which does not lapse until year-end 2026.
p. 75 · Read in context →
Moderna's summary of its multi-country patent-infringement campaign against Pfizer and BioNTech over its mRNA platform
We have brought patent-infringement actions against Pfizer Inc. (Pfizer), BioNTech SE (BioNTech) and related entities in the U.S. District Court for the District of Massachusetts, Germany, the Netherlands, the UK, Ireland and Belgium concerning our mRNA platform technology and disease-specific vaccine designs.
p. 217 · Read in context →
Merck & Co., Inc. (MRK)
Merck attacks Pfizer's single largest vaccine franchise — the Prevnar pneumococcal line — from both sides: a dedicated adult 21-valent vaccine (Capvaxive) and a pediatric/adult vaccine (Vaxneuvance). Merck's own filing quantifies Capvaxive's ramp and blames competition for Vaxneuvance's flat U.S. sales.
Merck describes Capvaxive, its adult-only 21-valent pneumococcal vaccine launched in 2024 that competes with Pfizer's Prevnar (2025 sales ~$759M)
Sales of Capvaxive, a vaccine for the prevention of invasive pneumococcal disease and pneumococcal pneumonia caused by certain serotypes in individuals 18 years of age and older
p. 84 · Read in context →
Merck attributes flat U.S. sales of its pneumococcal vaccine Vaxneuvance partly to competition — the same pediatric/adult market Pfizer's Prevnar leads
U.S. sales of Vaxneuvance were nearly flat year over year as a benefit from public and private sector purchasing patterns in the U.S. was offset by lower demand due to competition.
p. 84 · Read in context →
GSK plc (GSK)
GSK is Pfizer's sharpest adult-vaccines rival: its Arexvy competes head-to-head with Pfizer's Abrysvo in adult RSV, and its Shingrix anchors the adult-immunization market Pfizer is trying to grow into. GSK also earns royalties on Pfizer's Abrysvo and Comirnaty.
GSK says its adult RSV vaccine Arexvy held market-leading U.S. share among older adults — the market Pfizer's Abrysvo also contests (Q3 FY2025 call)
Luke Miels, Chief Commercial Officer: Turning to Arexvy […] in the U.S., we maintained our market-leading share in the older adults population.
p. 8 · Read in context →
GSK notes royalty income tied to Pfizer's Abrysvo (RSV) and Comirnaty (COVID) vaccines (Q1 FY2026 call)
Royalties benefited from Abrysvo and Comirnaty income streams.
p. 8 · Read in context →
GSK reports a record quarter for its Shingrix shingles vaccine, sizing the scaled adult-vaccine franchise Pfizer competes against (Q1 FY2026 call)
Shingrix was a key driver in Q1, setting a record for quarterly sales, delivering more than GBP 1 billion, up 20%.
p. 2 · Read in context →
AstraZeneca PLC (AZN)
AstraZeneca is Pfizer's largest-cap oncology rival, overlapping in breast cancer (Truqap vs. Pfizer's Ibrance) and in the PARP/prostate/ovarian space (Lynparza vs. Pfizer's Talzenna). AZN's oncology franchise is larger and faster-growing, and its filing claims share gains in exactly those tumor types.
AstraZeneca cites rapidly reached peak share for Truqap in second-line metastatic breast cancer — a market anchored by Pfizer's Ibrance
Truqap sales in the US increased by 44% […] as a result of a rapidly reached peak share in second line biomarker-altered metastatic breast cancer
p. 27 · Read in context →
AstraZeneca reports U.S. share gains for its PARP inhibitor Lynparza across ovarian, breast and prostate cancers — the same indications Pfizer's Talzenna targets
Lynparza sales in the US increased by 8% […] as a result of share gains across ovarian, breast and prostate indications.
p. 27 · Read in context →
Johnson & Johnson (JNJ)
J&J's Innovative Medicine segment competes with Pfizer in oncology and immunology. Its multiple-myeloma franchise (led by DARZALEX) is the incumbent wall Pfizer's Elrexfio must displace, while its immunology book (STELARA, TREMFYA) sits in the same market as Pfizer's Cibinqo, Litfulo and Velsipity.
J&J's DARZALEX is its single largest product at ~15% of revenue — the entrenched multiple-myeloma incumbent Pfizer's Elrexfio competes against
Sales of the Company's largest product, collectively DARZALEX (daratumumab) and DARZALEX FASPRO (daratumumab and hyaluronidase-fihj), accounted for approximately 15.0% of the Company's total revenues for fiscal 2025.
p. 11 · Read in context →
J&J's immunology sales fell as STELARA lost ground to biosimilars while TREMFYA gained share — the psoriasis/IBD market where Pfizer's I&I drugs compete
Immunology products sales were […] a decline of 11.8% as compared to the prior year primarily due to the decline of STELARA (ustekinumab) sales driven by the impact of biosimilar competition and Medicare Part D redesign. The growth of TREMFYA (guselkumab) was due to share gains and market growth.
p. 34 · Read in context →
Bristol-Myers Squibb Company (BMY)
Bristol Myers Squibb competes with Pfizer in immuno-oncology (Opdivo) and in oral immunology (Sotyktu vs. Pfizer's Litfulo and Cibinqo), even as the two firms co-market Eliquis as alliance partners. BMS's own filing describes the crowded IO market Pfizer's oncology portfolio also plays in.
Bristol Myers Squibb on the crowded immuno-oncology market where its lead PD-1 drug Opdivo competes in lung cancer and melanoma
Our IO products, particularly Opdivo, operate in a highly competitive marketplace. In addition to competing for market share with other IO products in approved indications such as lung cancer and melanoma, we face increased competition from existing competing IO products that receive FDA approval for additional indications and for new IO agents that receive FDA approval and enter the market.
p. 26 · Read in context →
Bristol Myers Squibb's oral psoriasis drug Sotyktu, a TYK2 inhibitor competing in the same market as Pfizer's Litfulo and Cibinqo
Sotyktu (deucravacitinib) is an oral, selective, allosteric tyrosine kinase 2 inhibitor indicated for the treatment of adults with moderate-to-severe plaque psoriasis who are candidates for systemic therapy or phototherapy.
p. 9 · Read in context →
More peer documents
MRNA_annual_report_FY2024 — 249 pages · Prior-year Moderna 10-K carrying the same Pfizer COVID/RSV competition framing and an earlier snapshot of the mRNA patent litigation — useful for the two-year trend. · Open →
Q4_FY2025 — 12 pages · Moderna management's full-year call: commentary on COVID vaccine share losses and RSV market entry against Pfizer. · Open →
MRK_annual_report_FY2024 — 192 pages · Merck's prior 10-K covering Capvaxive's launch year and Vaxneuvance framing before the 2025 competitive pressure — baseline for the Prevnar share fight. · Open →
JNJ_annual_report_FY2024 — 131 pages · Prior-year J&J oncology and immunology segment sizing to trend DARZALEX, STELARA and TREMFYA against Pfizer-overlapping franchises. · Open →
AZN_annual_report_FY2024 — 132 pages · AstraZeneca's FY2024 report, including its rare-disease assets acquired from Pfizer and the earlier oncology growth trajectory. · Open →
Q4_FY2025 — 15 pages · Bristol Myers Squibb's full-year call with management commentary on Opdivo/immuno-oncology competition and new-product launches. · Open →
Does not fit the framework (P1 not met)
Pfizer clears the universe cleanly and trips none of the hard exclusions, but the framework's one pure gate — very-high-conviction that year-10 revenue and free cash flow will both be higher than today — does not hold, and a failed gate is decisive on its own. The company's own FY2025 10-K forecasts a significant, accelerating 2026–2030 loss-of-exclusivity cliff across roughly a third of current revenue [1], and on the framework's adjusted-FCF basis the yield is negative. Confidence is high: two model families agreed, the trial was order-stable, and load-bearing spreads were at most 0.15. No flags fired — watchlist_only false, no exclusion hits, no prior-driven risk, nothing contested.
Universe and exclusions — clean
The screen is clean, and the clean screen is short. Pfizer is a Delaware-incorporated, NYSE-listed US common stock (ticker PFE) — not a Chinese company or ADR — so it clears the listing line (U1 met) [2]. Market capitalization is about $140.8 billion (a $24.64 close on 5,713 million shares), roughly 14x the $10 billion floor (U2 met) [3]. All four hard exclusions were checked and none was triggered:
- Auto/OEM (X1 — no hit): the entire revenue base is prescription medicines and vaccines; biopharma is $61.2B of $62.6B total revenue, with no automotive operations [4].
- Promotional CEO without delivery (X2 — no hit): management's record is mixed, not the disqualifying pattern. The $4B cost program was delivered, leverage came from ~4x to ~2.7x ahead of target [5], and the dividend was raised through the 2023 collapse [6] — but five-year total return of $86.4 on a $100 base badly lagged the peer group's $211.0, Starboard engaged, and insiders made no open-market purchases [7].
- Structural decline (X3 — no hit): revenue has not fallen high-single-digit for three consecutive years; the one down year (2023) was a COVID unwind on a growing base [8]. The forward patent cliff is a future threat, not a past decline — which is why it lands on the year-10 gate rather than here.
- Market darling (X4 — no hit): Pfizer trades near 2.2x sales and ~18x trailing GAAP earnings with a ~7% dividend and a chart down ~31% from its 2024 high — the opposite of a consensus-owned growth story [9].
One sensitivity is worth stating plainly. China is Pfizer's largest single market outside the US at 5% of 2025 revenue (~$3.1B), up from 4% in 2024, and management expects intensified generic competition and price cuts there through volume-based procurement (S1 — bounded ~5% sensitivity, not a listing exclusion) [10]. It is a real, directionally worsening demand headwind — not a China-listing problem, since the security is a US common share.
Pattern match
Pfizer superficially resembles two of the framework's four setups and fails the decisive check of each — so it fits none of them cleanly.
It looks most like the high-dividend-plus-high-FCF-yield pattern (BAT, AGNC): a ~7% dividend and a consensus forward FCF yield near 14–15%. But that pattern turns on the business not shrinking, and here the consensus forward curve itself declines — revenue from ~$61.9B (FY2025) to $54.5B (FY2029), adjusted EPS from $3.12 to $2.28 — as the patent cliff bites, so the yield sits on a contracting base rather than a stable one (Dislocation, Yield).
It also carries a trace of the healthcare forecasting-error pattern (Centene): the 13 October 2023 adjusted-EPS guidance cut from $3.25–3.45 to $1.45–1.65 was exactly that kind of one-year shock, and it round-tripped to $3.22 adjusted EPS by 2025 (Damage Math). But the framework's forecasting-error setup works because premiums reprice and the book mean-reverts; a pharmaceutical patent cliff does not reprice back — the molecule goes generic on a fixed clock. The mechanism that makes Centene work is absent here. It is not a cyclical-at-the-bottom or a quality-monopoly-on-a-fear-dip case.
The pillar ledger
Source: ruchir/fit_tally.json (per-criterion verdicts); underlying arithmetic from the tab claims ledgers cited in each section below.
Year-10 gate (P1) — not met
This is the decisive point. The gate asks for very-high conviction that year-10 revenue and adjusted FCF will both exceed today's, and any proper doubt fails it by construction. Pfizer's 176-year operating history, essential recession-resistant products supplied to ~200 countries, and a base business that grew ~6% operationally ex-COVID in 2025 all argue for durability [11]. Against that, the company's own 10-K anticipates a significant reduction of revenue from patent expiries across 2026–2030 that "will significantly accelerate," and warns that on loss of exclusivity a product's revenue can fall substantially "in a very short period of time" [12]. The exposed franchises — Eliquis $8.0B, Vyndaqel $6.4B, Ibrance $4.1B, Xtandi $2.2B, Xeljanz $1.1B, Adcetris $0.9B — sum to roughly $22.7B, about 36% of FY2025 total revenue, and Eliquis alone (13% of revenue) both loses US exclusivity in 2027 and takes an IRA-negotiated Medicare price from January 2026 [13]. The moat is intellectual property and an R&D/dealmaking engine (2025 R&D $10.4B, ~16.7% of revenue; capex only $2.6B, 4.2%), not the capital-intensity moat the framework prizes — so each product is a wasting asset the same patent regime hands to generics on expiry.
The strongest surviving counter-fact: the structural-decline disqualifier is genuinely absent, the non-COVID base grew from $45.7B (2023) to $54.5B (2025), and Pfizer has absorbed prior cliffs (Lipitor) across its history — 2026 guidance is ~4% operational growth ex-COVID and ex-LOE [14]. That is why the gate is a genuine doubt rather than a clear failure — but "genuine doubt" is exactly what the gate cannot survive. The jury put the probability the gate holds at 0.435 (spread 0.04, both families agreeing), below the very-high-conviction bar the pillar demands. Full treatment: Durability.
FCF consistency (P2) — cannot determine
The framework's stability test runs on adjusted FCF (FCF − stock-based compensation − 5-year-average acquisitions), and it cannot be formed: stock-based compensation is null in the data feed for every fiscal year 2016–2025, so the rolling 5-year adjusted-FCF series is not_computable. Reported FCF is the fallback — it has no negative years across the decade and a stable rolling 5-year average near $16–17B, but it has settled at $9.1B (2025) against a pre-COVID $13B mean, squeezed by interest on $63.5B net debt and IRA pricing [15]. Because the test's own basis is missing, the pillar is left undetermined rather than forced to a verdict. The named missing datapoints are listed in Contested and undetermined below. Full treatment: Yield.
Dislocation and yield (P3a–d)
A dislocation of framework magnitude exists (P3a met): from the December-2021 all-time high of $61.25, Pfizer fell 64.8% to the April-2025 trough and remains ~59.8% below, squarely in the 60–70% forced-selling zone [16]. But the three sub-tests that convert a drawdown into an entry fail.
The fear gauge is muted (P3b not met): the peak 20-day average volume through the fall was only 1.89x the pre-peak 180-day median — orderly repricing, not the capitulation surge the gauge looks for — and the heaviest days coincided with the April-2025 macro tariff shock and a quarterly options expiration rather than emotion-driven selling. The counter-fact is that the 1.89x peak landed exactly at the 2025-04-10 low, so what selling there was clustered at the trough. It is muted in magnitude, not mistimed.
On the framework's adjusted-FCF basis, the yield is negative (P3c not met): −4.5% on FY2025 and −5.2% on the 3-year average, clearing neither the 10% moderate bar nor the 25% levered bar — the shortfall is in sign, not basis points [17]. The arithmetic: FY2025 adjusted FCF = $9,075M reported FCF − $799M SBC − $14,671M five-year-average acquisitions = −$6,395M, or −4.5% on the $140.8B cap. The acquisition term alone ($14.7B/yr, off ~$84B of deals in seven years including Seagen at $43.4B) exceeds Pfizer's entire ~$9B of reported FCF, so even stripping M&A entirely the yield tops out near 5.9% [18]. The counter-fact: reported (unadjusted) FCF still yields a positive 6.4%, and Seagen was a one-time debt-funded deal that rolls out of the trailing window by ~2028.
Source: adjusted FCF = reported FCF − SBC − 5-yr avg acquisitions, derived from FY2021/FY2023/FY2025 cash-flow statements [19], [20]; consensus forward FCF per fit_features.consensus_forward_yield.
The path back above the bar is not underwritable (P3d not met). The skeptic weakened the original framing here: consensus forward FCF yields 11–15% unadjusted, and after SBC and the current five-year acquisition average it stays positive but only about 0–4%, approaching roughly 9.6–9.7% by FY2028–FY2029 only under a no-new-M&A decay case — so the adjusted path remains below the 10% bar, though it should not be described as still negative. The tally puts the probability of clearing the bar within 1–3 years at 0.105 (spread 0.14). Full treatment: Yield.
Balance sheet and self-help (P4a–c) — not met
Pfizer can comfortably outlast the cliff — only ~$3.0B of debt is due in 2026 against ~$20.6B of liquidity and $11.7B of FY2025 operating cash flow, with maturities laddered to 2065 [21]. But capital allocation is pre-committed to the dividend and to holding leverage flat, not to repurchases, exactly through the years the buyback tailwind would be strongest (P4a not met); management says repurchases will only "come back into greater consideration going forward" [22]. On the framework's reference line, the balance sheet is not fortress: the skeptic weakened this to moderate-to-levered — net debt about $63.5B, leverage 3.9x on unadjusted FY2025 EBITDA and ~3.1x after netting $14.1B of liquid investments, while S&P actual EBITDA and management's own ~2.7x gross figure put it nearer 2.2x–2.8x — so it is not a clean 25% levered-bar case and certainly not the net-cash fortress that would apply the gentler 8–9% bar [23].
The repurchase engine is off and pointed the wrong way (P4b not met): buybacks were zero in 2020, 2021, 2023, 2024 and 2025 (only a token $2.0B in 2022), ~$3.29B of authorization sits unused, and diluted shares rose from 5,632M (2020) to 5,713M (2025) on stock compensation with nothing repurchased [24]. A rising share count with the flywheel idle is the framework's self-help-failure condition. The counter-fact: the count is still ~7% below its 2016 level of 6,159M, and the drift up reflects only ~$0.8B/yr of SBC, not equity-funded deals.
Source: FY2025 and FY2023 Consolidated Statements of Cash Flows [25], [26].
The ~7.0% dividend is comfortably covered on earnings (~53% of adjusted EPS) but only ~0.93x on FY2025 free cash flow, with the gap plugged by $6.3B of Haleon stake sales (P4c not met) — safe near-term, but leaning on asset monetization rather than organic cash [27]. The dividend was maintained and raised to $1.72 through the 2023 earnings collapse, which is the counter-fact. Full treatment: Self-Help.
Diagnosis (P5) — not met
The adversarial trial — two opposing cited briefs, blind judges — put the probability the impairment is temporary at 0.39 (seats 0.39 / 0.34 / 0.41, mean 0.38, spread 0.07, not contested, order-stable), a ruling that leans permanent: about 6-in-10 that the drawdown priced real, lasting damage [28]. The damage arithmetic shows why the diagnosis is a lean, not a certainty: today's $140.8B cap prices ~$12.7B of flat perpetual FCF at a 9% cost of equity, which sits between FY2025 actual FCF of $9.1B (intrinsic ~$101B) and forward consensus FCF of $16–21B (intrinsic ~$178–229B) — so the price fall neither clearly overshoots nor undershoots the value damage, and the gap's existence is identical to the temporary-versus-permanent question [29]. The counter-fact keeping the lean shallow: the 0.07 spread is tight and the flip conditions are concrete and near-dated. Full treatment: Damage Math.
Instrument context (I1) — not verifiable
The framework's expression check (long-dated listed options, implied vol) cannot be verified from the corpus: the run has no options-chain or IV data file, and the only evidence is web-sourced (January-2028 LEAPS reportedly trade, total open interest ~1.5M contracts, 30-day mean IV ~25% as of 23 July 2026 — below the ~50–55 reference line). Because these rest on third-party web sources rather than a staged feed, I1 is recorded not_verifiable, not asserted. Full treatment: Clock.
What a 3x-in-3-years would require
The framework's re-rating test — price at bar-yield on normalized adjusted FCF — cannot be computed here. Per the tally: re-rating math is unavailable because the applicable bar or normalized adjusted FCF is missing. Adjusted FCF is not_computable (SBC null every year) and the balance-sheet class that scales the bar is unknown, so there is no clean bar-yield price to state.
What can be stated is the damage-math frame and the base rates. At a 9% cost of equity the current $140.8B cap already capitalizes ~$12.7B of durable FCF. For the equity to re-rate toward the temporary case, consensus would have to be validated over the FY2025 actual — FY2026–27 reported FCF converging on ~$16–21B against the $9.1B just delivered, lifting intrinsic value to ~$178–229B (a ~26–63% move) [30]. The base-rate context is discouraging on speed: Pfizer's own history (Clock) shows comparable-depth drawdowns reclaimed only after 2.7 to 22 years, and while volume-confirmed troughs have produced +72% to +127% partial rebounds within 10–21 months, the current episode's volume spike measured just 1.89x — short of the capitulation those rebounds followed. A framework 3x is not supported by the arithmetic available.
Contested and undetermined
Nothing was contested — the contested flag list is empty, and no criterion carried both readings.
One criterion is undetermined. P2 (FCF consistency) is cannot-determine because the adjusted-FCF stability series cannot be formed. The named missing datapoints, verbatim from the jury:
- adjusted-FCF rolling 5-year average — SBC absent for FY2016-2025, so adjusted FCF (and its stability) is not_computable per fit_features.not_computable.fcf_stability
- five consecutive adjusted-FCF years for rolling 5-year stability
- five consecutive adjusted-FCF years with SBC/acquisition adjustments for the rolling 5-year average
The reported-FCF fallback (no negative years; stable ~$16–17B rolling average) is available, but the framework's own basis is not, so the pillar stays undetermined rather than being rounded to a verdict.
Provenance
| Item | Result |
|---|---|
| Jury composition | 4 seats — a/b claude, c/d codex; masked probe = claude; 2 families |
| Cross-family agreement | Agreed on the P1 gate and every load-bearing criterion |
| Trial order-stability | temporary-first mean 0.39, permanent-first mean 0.375, gap 0.015 |
| Load-bearing spreads | P1 0.04, P5 0.07, P3d 0.14 — at most 0.15 |
| Name-mask probe | No gate criteria differed masked vs named; max probability gap 0.025; prior_driven_risk false |
| Skeptic pass | 40 claims seen; 17 fully checked — 14 survived, 2 weakened, 0 refuted, 1 unverifiable; 23 triaged |
Source: ruchir/fit_tally.json provenance block and ruchir/trial/tally.json.
The verdict was pressed hard and did not move. Two model families, run blind to what the reader hopes is true, agreed the year-10 gate fails; a name-masked re-run changed no gate criterion; and of the two claims a skeptic weakened — the balance-sheet class and the forward-yield path — both weakened toward the company (moderate-not-levered; positive-not-negative forward yield) yet neither lifted any pillar above its bar, so the does-not-fit result is unchanged.
The falsifier ledger
These are the standing what-would-change-this conditions carried from the tally. The first five are the framework's own templates; the remainder are the name-specific and trial-flip versions with their thresholds, directions and windows.
- adjusted FCF or EBITDA declines where flat-or-better was underwritten
- revenue declines for a third consecutive year
- capital allocation pivots to debt paydown over repurchases
- share count inflects upward
- the industry repricing cycle fails to materialize where industry-wide mean reversion was underwritten
- FY2026-27 actual FCF prints $16-20B (validating forward consensus over the $9.1B FY2025 actual) — would confirm NPV intact and move toward temporary
- Non-COVID operational growth sustains high-single-digits and holds total revenue flat/up through 2028 despite the accelerating LOE cliff
- Metsera/3SBio obesity and Seagen ADC pivotals deliver approvals that visibly refill the base before 2028, converting the 'partial offset' into a full one
- Conversely: FY2026 guidance cut, LOE headwind exceeding the $1.5B run-rate, or a dividend cut — would lock in permanent
- FY2026 revenue lands at or above $62.5B and adjusted EPS at or above $3.00, followed by FY2027 revenue above $62B and adjusted EPS above $3.20.
- Non-COVID operational revenue remains mid-single-digit positive through FY2027 while reported free cash flow exceeds $14B after dividends and interest.
- LOE and IRA headwinds for Eliquis, Ibrance, Xtandi, Xeljanz and Vyndaqel stay below the $1.5B 2026 run-rate and do not accelerate through 2028.
- Recent and acquired launches exceed $15B of annual revenue by FY2027 and management no longer describes them as only partial LOE offsets.
- FY2027 actuals print revenue above $62-65B and adjusted EPS above $3.25, showing base growth out-runs the LOE cliff rather than the reverse.
- Consensus 2028-2029 revenue/EPS stops declining and inflects upward as pipeline pivotal reads and launches land.
- FY2026-27 actual FCF converges toward the $18-20B consensus (vs the $9.1B FY2025 actual), restoring genuine ~2x dividend coverage.
Data gaps
- fit_features.revenue_trajectory is computed on income.json 'product revenues' only, which excludes alliance revenue (BioNTech-partnered Comirnaty) and royalties; it understates total revenues (2023 shows $50,914M vs reported total revenues of $59,553M) and the series stops at FY2023, so the COVID peak magnitude and current trajectory are read against the 10-K's reported Total revenues, not the feature figure.
- Adjusted FCF, adjusted-FCF yield, yield_baseline, fcf_stability and float_retirement_years are
not_computablein fit_features because stock-based compensation is null for FY2016–FY2025 and the acquisitions field defaulted to zero; these were rebuilt from the filed cash-flow statements (FY2021/FY2023/FY2025 10-Ks) and flagged, not silently substituted — the zero-acquisition assumption is materially wrong for a serial acquirer and should be corrected upstream. - balance_sheet_class = 'unknown' because EBITDA was missing for FY2025; leverage was reconstructed (net debt $63.5B; 3.9x on unadjusted EBITDA, ~2.2x–2.8x on S&P/management bases), leaving the class moderate-to-levered rather than deterministically set.
- No single filing quantifies the aggregate 2026–2030 LOE revenue-at-risk in dollars, or the year-10 net impact of IRA/MFN pricing; the ~$22B exposure is derived from the product-level patent table plus 2025 product revenues, not a Pfizer forecast.
- The forward-consensus FCF of $16–21B is ~2x recent actual FCF ($9.1B) and the vendor data does not reconcile the gap (working-capital/restructuring cash timing); this unresolved reconciliation is the pivot of the damage-gap and the trial's top flip condition.
- The corpus short-interest feed returned zero reported-position rows, and no holder-base/13F flow data was staged, so the short base and the trough sellers are third-party or absence-of-evidence reads, not primary time series.
- Options open-interest and IV are from third-party web sources (no CapIQ options feed in the run); IV is a single dated 30-day-mean reading, not an intraday quote.
- The corpus provides no citable global pharmaceutical market-share or R&D-concentration statistic; industry structure is characterized qualitatively (research-based oligopoly with named franchise rivals) rather than with a single concentration figure.
Business
Pfizer is a research-based global biopharmaceutical company: it discovers, makes, and sells prescription medicines and vaccines, booking $62.6 billion of revenue in 2025 across primary care, specialty care, oncology, and hospital/biosimilars [1] [2]. It clears both universe lines — a NYSE-listed US company at a ~$141 billion market cap. It is not a car maker and, down more than a fifth from its 2024 high and trading near 2.2x sales, not a consensus darling. The framework-relevant tension is durability: every drug is a wasting patent asset, and a 2026–2030 exclusivity cliff is disclosed.
What Pfizer is, in two sentences
Pfizer sells patented and off-patent prescription drugs and vaccines to healthcare systems worldwide — its largest franchises are the blood thinner Eliquis, the Prevnar pneumococcal vaccine family, the Vyndaqel cardiomyopathy family, and the COVID products Comirnaty and Paxlovid [3]. It earns money by discovering or acquiring molecules, winning regulatory approval, and selling them at a premium during a limited period of patent exclusivity, funding an R&D and dealmaking engine that must replace each product as its patent expires.
The company was incorporated in Delaware in 1942 and traces its roots to 1849 [4] — a genuinely long operating history [5]. It runs three operating segments — Biopharma, Pfizer CentreOne (contract manufacturing), and Pfizer Ignite — but Biopharma is the only reportable segment and supplies 98% of revenue [6] [7].
2025 Revenue ($M)
2025 Net Income ($M)
Market Cap ($M)
Employees
Sources: revenue and net income — FY2025 10-K, Consolidated Statements of Operations [8]; employees (~75,000 at 31 Dec 2025) — Item 1, Our People [9]; market cap ($140.8B) derived from a $24.64 close on 24 Jul 2026 and 5,713M shares (fit_features.market_cap).
The revenue arc — a COVID windfall, then reversion
The last five years are dominated by one event. Total revenues nearly doubled from $41.7 billion in 2020 to a peak of $100.3 billion in 2022 as Comirnaty and Paxlovid scaled, then fell back toward $62.6 billion in 2025 as COVID demand faded [10] [11].
Sources: 2020–2022 — FY2022 10-K, Total Revenues by Geography [12]; 2023–2025 — FY2025 10-K, Total Revenues by Geography [13]. Figures are continuing operations; pre-2020 years are not comparable because Pfizer spun off its Upjohn off-patent unit (Viatris, Nov 2020) and contributed consumer health to a GSK joint venture (2019).
Stripping out COVID, the underlying base is roughly flat-to-growing: management reports 2025 revenue fell 2% headline but rose 6% operationally excluding Comirnaty and Paxlovid [14]. The 2025 revenue split — $51.7 billion of product sales, $9.3 billion of alliance revenue (largely the BioNTech-partnered Comirnaty), and $1.7 billion of royalties — matters for the yield work in Yield, because the deterministic feature file measures the revenue trajectory on product revenues alone and so understates the COVID peak by the alliance component [15].
Product concentration and segment economics
Revenue is concentrated in a handful of franchises. Twelve products each cleared $1 billion in 2025 and together accounted for 65% of total revenue; Eliquis alone was 13% [16]. The commercial portfolio spans primary care (internal medicine, vaccines, migraine), specialty care, oncology (Ibrance, Xtandi, Padcev and the Seagen antibody-drug-conjugate portfolio), and a hospital/biosimilars book of sterile injectables and biosimilars [17].
Source: FY2025 10-K, Note 17C — Significant Revenues by Product [18].
The economics are high-gross-margin but R&D- and amortization-heavy: 2025 cost of sales ran 25.7% of revenue, R&D was $10.4 billion (17% of revenue), and amortization of acquired intangibles added $4.9 billion [19]. This is an intellectual-property business, not a capital-intensive one — capital expenditure was only $2.6 billion in 2025. The moat, where it exists, is a patent plus the R&D engine that refills the pipeline, not physical assets that are hard to reproduce.
Pfizer also pays a large, long-running dividend — $1.72 per share declared in 2025 [20], its 349th consecutive quarterly payout — and its stated capital-allocation order is to maintain and grow the dividend, reinvest, and repurchase shares only "after de-levering" [21]. At $24.64 that dividend is a ~7.0% yield; the subordination of buybacks to debt paydown is examined in Self-Help.
Geography — and the China sensitivity
Revenue is majority-US. In 2025 the United States generated $37.1 billion (59%) and international operations $25.5 billion (41%) [22].
Source: FY2025 10-K, MD&A — Total Revenues by Geography [23].
On China (the framework's S1 sensitivity), exposure is real but modest and quantified: China was Pfizer's largest market outside the US in 2025 at 5% of total revenue (about $3.1 billion), up from 4% in 2024 [24]. The exposure is a headwind, not a tailwind: management flags China's volume-based-procurement (VBP) and quality-consistency (QCE) generic programs as sources of continuing price cuts and volume loss for off-patent products [25]. Because Pfizer is a US-incorporated, NYSE-listed company, the China listing exclusion does not apply; this is a demand/pricing sensitivity of limited size.
A different concentration sits on the customer side: Pfizer's three largest US wholesaler customers — McKesson, Cencora, and Cardinal Health — represented 25%, 16%, and 13% of total revenue respectively in 2025 (54% combined), the standard US pharmaceutical distribution structure rather than end-demand concentration [26].
Market structure — the P1 raw material
Global pharmaceuticals is best described as a research-based oligopoly at the top, sitting above a large generic and biosimilar tier, with intense regulation on both entry and price. Pfizer's own filing calls its markets "intensely competitive and highly regulated," and names three distinct competitor types: other worldwide research-based firms, smaller focused research companies, and generic/biosimilar manufacturers [27]. No single company dominates the industry; competition runs franchise by franchise, and Pfizer's rivals name it directly in their filings.
Regulatory entry barriers are high — for a molecule, and time-limited. Bringing a drug to market requires FDA or EMA approval after years of clinical trials, which no garage startup can shortcut; a patent then grants a temporary monopoly on that molecule. But that same regime hands the franchise back to competition on expiry: once patent or regulatory exclusivity lapses, generic and biosimilar makers — often without large R&D costs — sell near-identical products at much lower prices, and revenue "can substantially decrease… often in a very short period of time" [28]. Pfizer discloses that it expects "a significant reduction of revenue from patent-based or regulatory exclusivity expiries in 2026 through 2030," with the rate of erosion accelerating [29]. This is the central durability question the report carries into Durability: the corporate entity is essential and long-lived, but each product is a wasting asset, so year-10 revenue depends on the pipeline and acquisitions replacing the coming cliff — not on a fixed moat.
Named competition, cited to rivals' own filings:
- Moderna identifies Pfizer/BioNTech as its principal COVID-19 vaccine competitor (Spikevax vs Comirnaty) and Pfizer as an RSV rival that reached the US market first [30].
- Merck attacks Pfizer's largest vaccine franchise, Prevnar, from both the adult side (Capvaxive) and the pediatric/adult side (Vaxneuvance), and blames competition for its flat pneumococcal sales [31].
- GSK competes head-to-head in adult RSV (Arexvy vs Pfizer's Abrysvo) and says it holds market-leading US share among older adults [32].
Bristol-Myers Squibb, Johnson & Johnson, and AstraZeneca round out the large-cap research peer set overlapping oncology, immunology, and cardiovascular. The takeaway for the framework: Pfizer is a durable, essential, long-established enterprise in a regulated oligopoly, but its durability rests on continuous product replacement rather than the fixed, capital-heavy, "someone-else-cannot-build-this" moat the system prizes most.
Universe screen
Both universe lines are cleared. Listing (U1): Pfizer is a US company incorporated in Delaware and listed on the New York Stock Exchange — not a Chinese company or Chinese ADR. Scale (U2): market capitalization is roughly $140.8 billion, about 14x the $10 billion line.
The market-cap figure is the deterministic feature (fit_features.market_cap_usd): a $24.64 close on 24 July 2026 times 5,713 million shares outstanding [33]. The US listing and Delaware incorporation are stated in Item 1 [34].
First-pass exclusion screen
Auto OEM (X1): no. Pfizer makes medicines and vaccines; it is not an automobile manufacturer. No hit.
Consensus-saturated darling (X4): no. Pfizer screens as the opposite of a crowded growth story. It trades at about 2.2x sales ($140.8 billion market cap on $62.6 billion revenue) and roughly 18x trailing GAAP earnings, pays a ~7% dividend, and its chart runs top-left-to-bottom-right — down about 21% from a July 2024 high (and as much as 31% into its April 2025 low) and far below its 2021–2022 COVID-era peak [35]. Consensus is cautious, not euphoric: the sell side models a declining forward FCF profile against the disclosed 2026–2030 patent cliff [36]. The multiple, the yield, and the drawdown all point away from a saturated darling; the anatomy of the decline is developed in Dislocation.
China dependence (S1): flagged and quantified. China is 5% of 2025 revenue (~$3.1 billion) and a pricing headwind, not a listing problem — a limited sensitivity, detailed above [37].
The promotional-CEO (X2) and structural-decline (X3) checks belong to Self-Help and Durability; nothing in the business description settles them here, though the disclosed patent cliff is the fact those tabs must weigh temporary reversion against.
Dislocation
Pfizer's recent decline is shallow and diffuse by this framework's standard. The feature file's window runs from a $31.39 peak on 30 July 2024 to a $21.59 trough on 10 April 2025 — a 31.2% fall over 254 days, with the trough leg driven by the April-2025 tariff shock rather than a company-specific guidance cut. Volume spiked only 1.89× its pre-peak median — orderly repricing, not capitulation. Earnings beat consensus throughout the fall.
The drawdown, quantified
The capitulation gauge in the deterministic feature file is the source of record for the recent move: a peak close of $31.39 on 30 July 2024, a trough of $21.59 on 10 April 2025, and a current price of $24.64 (24 July 2026) — a 31.2% peak-to-trough decline over 254 days, with the stock since recovering 14.1% off the low while remaining 21.5% below the July-2024 peak.
Peak (30 Jul 2024)
Trough (10 Apr 2025)
Current (24 Jul 2026)
Peak-to-Trough
Source: fit_features.capitulation_gauge.drawdown, derived from daily closing prices; peak, trough, and current match the feature file exactly.
That 31% window sits inside a much larger multi-year de-rating that is the drawdown Ruchir's framework would actually recognise. From the COVID-era peak of $61.25 on 16 December 2021, Pfizer fell 64.8% to the April-2025 trough and remains 59.8% below that peak today. The bulk of that decline is the 2022–2023 unwind of the pandemic revenue windfall — Comirnaty and Paxlovid — a known normalisation of one-time revenue rather than fear repricing an ongoing franchise. The feature-file window is a further leg on top of an already-halved stock.
Source: daily closing prices, data/prices/daily.json; peak/trough/current cross-checked to fit_features.capitulation_gauge. The pandemic-windfall unwind (2022–2023) dwarfs the recent window.
The legs, and the trigger
The 31% fall came in identifiable legs, and the sharpest one was macro, not company-specific. The event dates below are separated from the surrounding drift.
Source: daily prices, data/prices/daily.json; event attribution from Pfizer filings and dated press coverage as cited below.
The event leg versus the drift. The first 10% off the July peak was drift — through August and September 2024 the stock held near $29 on below-average volume, with no dated catalyst. The company-specific fear arrived in mid-November 2024: the stock fell 4.7% on 15 November, its worst single session of the fall, as vaccine-policy risk repriced across the sector following the HHS-secretary nomination. The deepest and most concentrated leg was macro: the early-April 2025 tariff shock. Pfizer dropped 5.4% on 4 April and made its $21.59 closing low on 10 April 2025, inside the market-wide sell-off — the largest single-day move of the entire drawdown was not a Pfizer event.
Management addressed the tariff overhang directly on the Q1 2025 call (29 April 2025), fielding analyst questions on whether pharmaceutical duties would arrive via the Section 232 route and on their cash-flow impact [1]. The one clearly company-specific pipeline setback in the window — the 14 April 2025 discontinuation of the oral obesity candidate danuglipron after a liver-safety signal in a single trial participant — landed after the price low and was discussed on that same call [2].
What is absent is the framework's canonical trigger: a dated earnings or guidance cut the market anchored to. The opposite happened. On 17 December 2024, mid-drawdown, Pfizer issued 2025 guidance projecting double-digit operational EPS growth, and at Q4 results on 4 February 2025 it reaffirmed that guidance — revenue of $61.0–64.0 billion and adjusted diluted EPS of $2.80–3.00 [3]. The structural overhang that keeps the multiple depressed is not a one-year forecast error but the slower patent cliff — a sequence of major-product losses of exclusivity beginning with Eliquis late this decade [4]. That is a durability question, not a dislocation trigger; it belongs to the Durability and Damage Math tabs.
The fear gauge
Traded volume through the fall never reached capitulation levels. The feature file measures a volume spike multiple of 1.89× — the maximum 20-day average daily volume in the peak-to-trough leg (about 68 million shares, reached at the 10-April trough) against the median daily volume of roughly 36 million over the 180 days before the peak.
Source: daily volume, data/prices/daily.json; spike multiple of 1.89× from fit_features.capitulation_gauge.volume_spike. Pre-peak median daily volume ≈ 36M shares.
A 1.89× spike is a real uptick but a mild one — the two heaviest months, March and April 2025 at roughly 58 million shares a day, coincide with the macro tariff leg, and one of the single largest print days (21 March 2025) was a quarterly options-expiration date rather than emotion-driven selling. Ruchir's gauge looks for a volume surge marking peak fear — the kind that accompanies a 60–70% forced-selling flush. On this measure the recent leg reads as orderly repricing of a policy and patent-cliff overhang, not a capitulation event.
Who was selling
There is no evidence of forced or structural sellers driving the fall, and the disclosed activity points the other way. In early October 2024, near the start of the decline, Starboard Value disclosed a roughly $1 billion activist stake and enlisted Pfizer's former CEO and CFO — an informed buyer accumulating into weakness, not a seller. Reported short interest is modest: about 126.6 million shares as of mid-November 2025, near 2.2% of float with roughly 2.1 days to cover, below the peer-group average — so the drawdown was ordinary long-holder repricing, not a short attack or a squeeze setup.
The corpus's short-interest feed returned no reported-position rows for Pfizer, so a full time series of the short base through the fall cannot be constructed from the primary data; the level and days-to-cover above are from public short-interest aggregators as of late 2025. No index-exit, fund-liquidation, or large insider-sale event is disclosed in the corpus around the trough.
Estimates versus price
The framework's signature setup — a price fall that outruns the estimate cut — is not present here, because the estimate cut is not present. Through the drawdown and the recovery, Pfizer beat consensus adjusted EPS in every quarter reported:
Source: consensus-versus-actual from data/sp/estimates.json (beat_miss); reported figures as first effective on each release date.
Forward estimates confirm the picture. On the feature file's consensus-forward series, mean analyst free cash flow implies a yield on the current $140.8 billion market cap of 13.2% for 2025, 14.6% for 2026, and 11.2% by 2029 — above the framework's 10% default reference line at every forecast year, and the sell side is not modelling a collapse. Over the recovery window the estimate line has been essentially flat: current-year consensus EPS held near $2.94–2.96 across the trailing 90 days, and 2027 revenue drifted within a percent of $59 billion. Whether that adjusted-yield picture survives the framework's stricter FCF definition is the Yield tab's question; here the timing point stands on its own — the price fell, but consensus did not fall with it in the recent window. The de-rating was a compression of the multiple on policy and patent-cliff fears, not the market anchoring to a slashed forecast.
Source: forward FCF yields from fit_features.consensus_forward_yield (per-FY, on current market cap); estimate-revision path from data/sp/estimates.json (momentum) and data/estimates/analyst_estimates.json (eps_trend).
What this establishes
Measured against Ruchir's entry trigger, the recent Pfizer drawdown is a weak dislocation. Depth (31% in the feature window) is well short of the 60–70% forced-selling flush the pattern hunts; the volume gauge (1.89×) reads as orderly, not capitulative; the sharpest single leg was the macro April-2025 tariff shock rather than a company event; and there is no anchored earnings cut — the company beat and reaffirmed throughout, and forward consensus FCF yield clears the reference line. The genuinely large decline is the older, largely-realised unwind of the COVID revenue windfall, sitting on top of a patent-cliff overhang. Whether that overhang is a temporary impairment the market has over-discounted or a permanent one it has priced fairly is not settled here — it is the question the Damage Math tab and the trial decide.
Damage Math
The centerpiece question — whether the market destroyed more value than the problem did — resolves to a near-tie. At 9%, Pfizer's $140.8bn market cap capitalizes about $12.7bn of flat perpetual free cash flow: above the $9.1bn generated in FY2025, below the $16–21bn the sell side forecasts. The price fell about as far as a fair reading of durable-cash-flow damage, so the gap the framework hunts is not present; the trial leans permanent (probability temporary 0.39).
The near-term hit
Pfizer's dislocation has two dated earnings resets stacked on each other, and they point in opposite directions.
The first is the canonical Centene-shaped cut. On 13 October 2023 Pfizer took 2023 revenue guidance from $67.0–70.0bn down to $58.0–61.0bn and adjusted diluted EPS from $3.25–3.45 to $1.45–1.65 — a 54% cut to the earnings line — "solely due to its COVID products" [1] [2].
Source: Q3 2023 earnings release, revised 2023 guidance [3] [4].
That cut did not stick to the earnings line the way Centene's did. By FY2025 adjusted diluted EPS had recovered to $3.22, up 4% on 2024 [5], and stripping Comirnaty and Paxlovid, total revenues grew 6% operationally in 2025 [6]. Through the drawdown and recovery Pfizer beat consensus adjusted EPS in every quarter — surprises of +16% to +73% across 2024–2025, per the vendor beat/miss record (Dislocation documents the quarter-by-quarter beats). On the near-term axis, the numerator recovered; the price did not follow it up.
The second reset is slower and still in progress: the forward curve itself declines. Consensus as of 24 July 2026 has revenue easing from $61.7bn in FY2026 to $54.5bn by FY2029 and adjusted EPS from $2.94 to $2.28 — a 22% EPS erosion over three years, not a single-quarter air-pocket.
Source: FY2025 actual from the FY2025 10-K [7]; FY2026–FY2029 mean estimates from data/sp/estimates.json (annual).
The revisions inside that curve are small. Over the trailing 180 days consensus FY2027 revenue moved from $58.97bn to $59.37bn (+0.7%) and FY2028 adjusted EPS from $2.44 to $2.42 (−0.7%). The forward numbers have been broadly stable for six months; the decline is baked into the level, not being freshly cut. That matters for the framework: there is no live estimate cut for the price to be anchoring to. The market is discounting a lower durable level, not reacting to a fresh forecast miss.
Source: revision path from data/sp/estimates.json (momentum, now vs 180-days-prior).
The price move over the same window
Market cap, peak — 30 Jul 2024 ($bn)
Market cap, trough — 10 Apr 2025 ($bn)
Market cap, current — 24 Jul 2026 ($bn)
Enterprise value, current ($bn)
Source: shares outstanding 5.713bn and daily closes from fit_features (market_cap, capitulation_gauge); net debt $63.5bn from fit_features.balance_sheet_class; peak/trough caps = close × 5.713bn shares; EV = market cap + net debt.
The equity fell $56.0bn peak-to-trough (−31.2%) and sits $38.6bn (−21.5%) below the July-2024 peak today. Set the two moves side by side and the framework's signature setup is inverted: over the recent window consensus FY2026 EPS barely moved, yet market cap fell 21.5% — the price cut the numerator, not the analysts. The enterprise value compressed less than the equity, because net debt rose roughly $29bn since 2022 to fund the $44.2bn Seagen acquisition — leverage absorbed part of the blow the equity took (the maturity picture is the Self-Help tab's).
The NPV arithmetic
Two transparent scenarios, one discount rate, workings on the page. The consensus free-cash-flow figures are struck after cash interest, so they are equity free cash flow; I discount them at a 9% cost of equity and compare the result to the equity market cap, not enterprise value.
Assumptions (stated): discount rate 9%; free cash flow treated as levered (equity) FCF; a level reached and then held flat in perpetuity, so intrinsic equity value = durable FCF ÷ 0.09. No terminal growth is credited — any positive growth raises every figure below and widens the temporary-case gap, so the flat assumption is conservative against the temporary reading.
The anchoring fact: at 9%, today's $140.8bn market cap is exactly the capitalized value of $12.7bn of flat perpetual FCF ($140.8bn × 0.09). The market is pricing durable FCF at $12.7bn — above the $9.1bn Pfizer actually produced in FY2025, below the $15.8–20.6bn the sell side forecasts. The price has split the difference between recent reality and the forecast.
Source: durable-FCF anchors from FY2025 actual (data/financials/cash_flow.json, FCF $9.08bn) and consensus means (data/sp/estimates.json); intrinsic = FCF ÷ 0.09; market cap $140.8bn from fit_features. The final column is expressed in percentage points of equity value.
The two scenarios fall straight out of that table.
Temporary. If FY2025's $9.1bn FCF is an air-pocket — restructuring cash costs, Seagen-integration working capital, one-time drags — and durable FCF reverts toward the consensus $16–21bn, intrinsic equity is $178–229bn. Against today's $140.8bn, the $38.6bn price fall over-shot the value damage by $37–88bn. In that reading the gap Ruchir wants is real and large: the market destroyed materially more than the problem did.
Permanent. If durable FCF is anchored near recent actuals — because the 2026–2030 LOE cliff grinds the post-COVID base down the way the COVID roll-off ground the 2022 peak down — then $9–11bn capitalizes to $101–122bn. Today's $140.8bn already sits above that; the price fall is deserved and arguably insufficient. In that reading there is no gap: the NPV damage matches or exceeds the price damage.
The market price ($140.8bn) sits between the two anchors, almost exactly on the $12.7bn-perpetuity line. Whether a mispricing gap exists is therefore not a separate question from temporary-versus-permanent; it is the same question. The arithmetic alone does not establish a gap — it says only that the price is fair if durable FCF is about $12.7bn, cheap above that level and dear below it.
The temporary-or-permanent trial
The diagnosis was tried by two opposing, corpus-cited briefs and ruled on by three blind judges. Both cases are strong; neither is a straw man.
The case for temporary — at its strongest. The −44.5% revenue drop from $91.8bn (2022) to $50.9bn (2023) is almost entirely the roll-off of a pandemic windfall that never belonged in the run-rate; normalization toward a base is not impairment of earning power. Underneath the unwind the ongoing business compounds — non-COVID revenue grew 6% operationally in 2025 [8] — and management reaffirmed FY2026 guidance of $59.5–62.5bn revenue and $2.80–3.00 adjusted EPS after absorbing the LOE and COVID headwinds [9]. A permanently impaired business does not reaffirm forward guidance while raising its non-COVID growth rate, and consensus free cash flow of $16–21bn — above the pre-pandemic base — throws off a double-digit yield at today's price.
The case for permanent — at its strongest. The 2021–2022 cash-flow peak was an emergency-demand pool, not a franchise: Comirnaty and Paxlovid were 57% of 2022 revenue, and Pfizer itself warned post-pandemic revenues "may not be at similar levels" [10]. Those two products fell from $56.7bn in 2022 [11] to $6.7bn in 2025 [12]. The replacement is not being rebuilt fast enough, and the next leg attacks today's core: patent and regulatory expiries are expected to "significantly accelerate over the next few years" [13], with the IRA's Maximum Fair Price live on Eliquis from 1 January 2026 and roughly $1.5bn of LOE headwind in 2026 alone [14]. Consensus already embeds the savings and still shows FY2026–29 EPS below 2025 and far below 2022 — a lower durable level, which is exactly what the FY2025 actual FCF of $9.1bn (against $16–21bn forecast) suggests the cash statement is already registering.
The ruling. The judges put the probability the impairment is temporary at 0.39, with individual seats at 0.39, 0.34 and 0.41 (mean 0.38, spread 0.07). The ruling is not contested, and it is stable to reading order (temporary-first mean 0.39 versus permanent-first 0.375, a 0.015 gap). It leans permanent: the weight of evidence favors a genuinely lower durable base — roughly a 6-in-10 read that the drawdown priced real, lasting damage rather than a transient air-pocket. That diagnosis is the report's, and this tab does not override it; the arithmetic above only frames why the price sits where a fair split between the two readings would put it.
Which line broke, and whether it self-corrects
Two products carry the whole story. Comirnaty and Paxlovid went from $56.7bn of 2022 revenue [15] to $6.7bn in 2025 [16] — a windfall retreating to an endemic base, the part that is mechanically "temporary." Layered behind it is a durable erosion: 2025's still-core products — Eliquis ($8.0bn), Vyndaqel ($6.4bn), Ibrance ($4.1bn), Xtandi ($2.2bn) and Xeljanz ($1.1bn) [17] [18] — all face exclusivity loss or IRA pricing across 2026–2028, with the reduction expected to "significantly accelerate over the next few years" [19] [20]. This is the part the framework must weigh as possibly permanent.
The recovery mechanism is a pipeline and cost-out program refilling the base: Seagen's ADC platform, Metsera and 3SBio in obesity, and roughly $5.7bn of cost-realignment savings. But the tell sits in Pfizer's own slide: upcoming LOEs are "expected to be partially offset by strong revenue growth from recent launches and acquired products" [21]. Management characterizes the refill as partial, not full — and until buybacks resume after de-levering [22], the buyback flywheel that would compound a cheap yield is switched off. A self-correcting cliff would refill the base fully before 2028; a structural one would leave the launch basket permanently short of the exclusivity losses. The trial weighs that unresolved refill at a 0.39 probability of temporary — which is where the diagnosis, and the value question this tab computes around, rests.
Yield
On the framework's adjusted-FCF basis, Pfizer's yield is negative — about −4.5% on FY2025 figures, −5.2% on the three-year average — because a serial-acquisition habit (a five-year average near $14.7 billion a year: Seagen, Array, Biohaven, Metsera) exceeds the company's entire reported free cash flow of roughly $9 billion. Even ignoring acquisitions, reported FCF yields 6.4% at today's $140.8 billion market cap, below the 10% bar and below the 8–9% fortress floor. Consensus, measuring unadjusted FCF, sees more than 10% — the gap is the M&A the patent cliff keeps forcing.
Adjusted FCF = reported FCF − stock-based compensation − the trailing five-year average of acquisition spend. For Pfizer the acquisition term alone (~$14.7B/yr) is larger than reported FCF (~$9B), so adjusted FCF is below zero across FY2023–FY2025. This is the "drops out once adjusted" pattern in an extreme form.
The adjustment, line by line
The three inputs are all taken from the filed cash-flow statements. Reported FCF is operating cash flow less capital expenditure. Stock-based compensation is small for a company this size — under $1 billion a year. The decisive term is acquisitions: Pfizer paid $10.9 billion for Array in 2019 [1], roughly $23.0 billion across Biohaven, Arena, GBT and others in 2022, $43.4 billion for Seagen in 2023 [2], and $6.9 billion for Metsera in 2025 [3]. Averaged over any trailing five years, that lands between $13 billion and $15 billion of annual acquisition outflow.
Adjusted FCF = reported FCF − SBC − trailing 5-fiscal-year average of acquisitions of businesses, net of cash acquired; derived from company filings. Components: FY2025 10-K Consolidated Statements of Cash Flows [4]; FY2023 10-K [5]; FY2021 10-K [6].
The workings for FY2025: reported FCF of $9,075 million, less SBC of $799 million [7], less the FY2021–FY2025 acquisition average of $14,671 million (the mean of $0, $22,997, $43,430, $0 and $6,927 million), equals −$6,395 million. The fit_features file reports this line as not_computable because its input feed carried no SBC and treated acquisitions as zero — a material error for a company that has spent roughly $84 billion on acquisitions in seven years. The figures above rebuild the series directly from the filed statements; the correction is recorded in the data gaps below.
Seagen alone tells the story: a $44.2 billion purchase ($43.4 billion net of cash), funded largely by $30.8 billion of new long-term debt issued in 2023 [8]. The framework treats normalized M&A as a recurring claim on owner cash precisely because a company facing a patent cliff must keep buying assets to replace expiring revenue — which is exactly Pfizer's position.
The yield, three ways
Adjusted FCF Yield — FY2025
Adjusted FCF Yield — 3-yr avg
Reported FCF Yield — FY2025
Adjusted FCF divided by the current $140.8B market cap ($24.64 × 5,713M shares, 24 Jul 2026); derived from company filings and the price feed. Reported FCF yield shown for contrast.
Current adjusted yield is −$6,395 million on a $140.8 billion market cap, or −4.5%. The three-year average adjusted FCF of −$7,304 million gives −5.2%. Both sit below zero. Reported FCF yield — the number a screen would show — is 6.4% (FY2025) and has ranged 3.4% to 7.0% over the last three years. The company's own yield baseline distribution is not_computable on the adjusted basis: with adjusted FCF negative in each recent year, there is no positive baseline for a current level to be a jump from. The fortress signature Ruchir hunts — a stable ~3.5–4% name suddenly near 8–9% on a fear scare — does not appear here. What appears instead is a reported FCF yield that has been structurally lower since the COVID windfall unwound, not a stable series dislocating upward.
Which bar applies
The balance-sheet class the framework uses to pick the reference line is unknown in fit_features only because EBITDA was missing from its feed. Rebuilding it: FY2025 EBITDA is income from continuing operations before taxes of $7,520 million [9], plus depreciation and amortization of $6,592 million [10], plus net interest expense of $2,068 million [11], or $16,180 million.
Net debt = long-term debt $61,641M + current portion of long-term debt $2,997M − cash $1,142M; liquid investments = short-term $12,454M + long-term $1,621M; EBITDA $16,180M. Balance sheet [12]; interest [13].
Net debt of $63,496 million against $16,180 million of EBITDA is 3.9x [14] — above the framework's 3.0x threshold, so the rule classes it levered. Netting Pfizer's $14.1 billion of short- and long-term investments still leaves 3.0x, at the levered line. This is not a fortress: the fortress class needs net cash or net debt under 0.5x EBITDA, and Pfizer is six to eight times that. So the reference line the framework selects is the 25% levered bar, not the 10% moderate bar.
The distinction is moot for the verdict. At −4.5% adjusted, the yield clears neither the 25% levered bar nor even the most lenient 10% moderate line — the shortfall is not measured in basis points but in sign. And the levered exception (the framework tolerates leverage only when the yield is massive, the buyback habit is demonstrated over years, and FCF/revenue is not deteriorating) fails on every limb: the yield is negative, buybacks were zero in 2023, 2024 and 2025 while share count rose, and — as the Self-Help tab develops — capital allocation has pointed at debt paydown and the dividend, not repurchases.
Normalized mid-cycle yield
Pfizer is not a classic cyclical, but its cash flow is distorted by two things worth normalizing: the COVID windfall that inflated FY2021–FY2022 FCF (reported FCF of $29.9 billion and $26.0 billion on revenues of $73.6 billion and $91.8 billion) and the Seagen acquisition bulge that dominates the trailing five-year M&A average today. A skeptic can recompute the mid-cycle yield under two explicit assumptions.
Assumption one — acquisitions revert to bolt-on scale. If Pfizer honors its stated intent to pause large M&A and delever, and the trailing acquisition average falls toward a bolt-on ~$3–4 billion a year as Seagen rolls out of the five-year window (around 2028), then adjusted FCF ≈ $9.1B reported − $0.8B SBC − $3.5B acquisitions ≈ $4.8 billion, or a 3.4% yield. Better than negative, still a third of the 10% bar.
Assumption two — ignore acquisitions entirely. Treating all M&A as discretionary growth capital, the ceiling is reported FCF less SBC: $9.1B − $0.8B ≈ $8.3B, a 5.9% yield. This is the most generous number that can honestly be constructed, and it still sits below the 8–9% fortress floor and well below the 10% moderate bar — before any allowance for the 2026–2030 loss-of-exclusivity wave (Eliquis, Vyndaqel, Ibrance, Xeljanz) that consensus expects to lower, not raise, near-term revenue. On no defensible normalization does Pfizer reach the bar its balance sheet demands.
The consensus check
CapIQ consensus measures free cash flow on the vendor's standard basis — cash from operations less capital expenditure, with no deduction for acquisitions or SBC — so it is not comparable to Ruchir's adjusted number and runs far higher.
Consensus FCF (CapIQ, CFO − capex basis) divided by the current $140.8B market cap; from data/sp/estimates.json. Bar shown at 10%.
On its own basis, consensus clears the moderate bar comfortably: forward FCF of $20.6 billion (FY2026), $17.7 billion (FY2027) and $15.8 billion (FY2029) implies yields of 14.6%, 12.6% and 11.2% on today's market cap. Read literally, the sell side already agrees the cash yield is high and the buy side is merely fearful — the strong-setup reading. But the entire gap between that picture and the framework's −4.5% is the two adjustments consensus omits. Consensus forward FCF also averages roughly $18 billion, nearly double Pfizer's reported statutory FCF of ~$9 billion, because it normalizes away working-capital swings and one-off cash items. Subtract SBC and the ~$14 billion five-year M&A average — the cash Pfizer actually spends replacing patent-cliff revenue — and the forward yield goes negative on the same estimates. The consensus does not underwrite the framework's bar; it underwrites a different, gross definition of free cash flow.
FCF-to-revenue trend
Conversion has recovered off the 2023 trough but remains structurally below the pre-COVID level, and turns negative once the acquisition drag is included.
Reported FCF ÷ total revenues; derived from company filings. Total revenues from the FY2025 10-K Consolidated Statements of Operations [15]; FCF from the cash-flow statements.
Pre-COVID, Pfizer converted 26–29% of revenue to free cash (FY2019–FY2020). The COVID years spiked to 41% then fell back; FY2023 collapsed to 8% on COVID inventory write-offs and the Seagen close; FY2024–FY2025 recovered to 14–15% [16]. So on the reported line, conversion is stabilizing — but at roughly half the pre-COVID rate, which cuts against the flywheel. On the framework's adjusted basis, conversion is negative, because acquisitions consume more than the whole of free cash flow. One further stress point on the cash claim: FY2025 dividends paid of $9,771 million already slightly exceed reported FCF of $9,075 million, a 0.93x coverage ratio [17]; the ~7% dividend, not repurchases, is where owner cash is going. Its safety is developed in Self-Help.
What would change this read: a genuine multi-year pause in large acquisitions (which would let the trailing five-year average fall toward bolt-on scale and lift adjusted FCF toward the reported ~6% line), or a step-up in reported FCF back toward the ~$16–17 billion five-year rolling average that would push even the acquisition-adjusted number toward positive. Neither is visible in the current filings or the consensus path.
Pfizer clears two of the framework's conviction tests plainly — a 176-year operating history and essential, recession-resistant products — but not the market-structure or entry-barrier tests: its moat is a portfolio of time-limited patents, contested drug by drug. The 10-K itself forecasts an accelerating 2026–2030 revenue reduction from patent expiries covering roughly a third of today's revenue, with the single largest product hit at once by patent loss and a mandated Medicare price. The year-10 gate carries genuine doubt.
Grading the Conviction Sources
Ruchir's year-10 conviction is built from five specific sources: market structure, regulatory entry barriers, capital intensity as a moat, essentialness, and operating history. Each is graded for Pfizer on its own evidence below — a source that does not apply is said not to apply, not argued around.
Sources: operating history — company website [1] and 2025 proxy [2]; R and D and market structure — FY2025 Form 10-K [3].
Two sources are genuine and strong. Pfizer has operated since 1849, when Charles Pfizer and Charles Erhart founded it in Brooklyn [4]; the 2025 proxy frames that 176-year record as the base of its forward case [5]. Its products are essential and its end-demand holds through downturns.
The other three are where Pfizer diverges from the pattern Ruchir hunts. It is not a monopoly or duopoly — the market-structure conviction that the Business tab establishes for a tollbooth does not transfer here. Its regulatory barrier is real for launching a drug but is deliberately dismantled for each drug on a schedule. And its capital intensity is intangible: the asset is a pipeline, and a pipeline is refilled by execution, which the framework does not count as a moat.
Revenue History and the Disqualifier
The framework's disqualifier is mechanical: revenue declining high-single-digit for three consecutive fiscal years after a long existence. The deterministic feature file computes three_year_hsd_decline = false — the flag is not triggered — on a revenue series that shows one down year (2023), not three consecutive.
Source: fit_features.revenue_trajectory (product revenues per data feed); reconciles to the FY2023 10-K Consolidated Statements of Operations, where 2023 product revenues were $50,914M [6].
Two cautions on that chart. First, the feature series is product revenues only — it excludes alliance and royalty revenue (about $8–11B a year) and therefore runs below Pfizer's reported total revenues; on the feature's own basis it also stops at FY2023 because the data feed carries no product-revenue figure for FY2024–FY2025. Second, the 2018 drop reflects a segment reclassification, not an operating collapse, and it is a single year. On the fuller total-revenues basis the arc is dominated by the COVID windfall and its unwind.
Sources: FY2023 10-K for 2021 ($81,288M) and 2022 ($100,330M) [7]; FY2025 10-K for 2023–2025 ($59,553M / $63,627M / $62,579M) [8].
Total revenues peaked at $100.3B in 2022 on Comirnaty and Paxlovid, then fell to $59.6B in 2023 as those two products collapsed from a combined ~$56.7B (2022) toward ~$6.7B (2025) [9]. Stripping COVID out reveals the durability signal that matters: the base business grew from $45.7B (2023) to $54.5B (2025) [10], and management states that excluding Comirnaty and Paxlovid, total revenues rose 6% operationally in 2025 [11]. So the structural-decline disqualifier (X3) is checked and absent: this is a COVID normalization sitting on top of a growing base, not three years of high-single-digit erosion.
The Patent Cliff
The absence of a past decline does not settle the year-10 question, because the largest structural threat is dated in the future and Pfizer names it in its own words. The FY2025 10-K states it anticipates "a significant reduction of revenue from patent-based or regulatory exclusivity expiries in 2026 through 2030," with "the rate of the reduction of revenues… expected to significantly accelerate over the next few years" [12]. This is not an analyst's inference; it is the company's disclosure.
The exposure can be sized from the patent table and the product-revenue detail. Products with U.S. basic-patent expiries in 2026–2027 accounted for roughly $22B — about a third — of 2025 revenue.
Sources: patent-expiry years — FY2025 10-K Patents and Intellectual Property Rights [13]; 2025 product revenues — FY2025 10-K MD and A Selected Product Discussion [14].
Two features make this cliff heavier than the headline dollar figure. Patent expiry precedes, but eventually invites, generic and biosimilar entry, and when it arrives "price competition can substantially decrease our revenues for the impacted products, often in a very short period of time" [15]. And the concentration is acute: Eliquis alone was 13% of total revenue in 2025, and it faces a double hit — a U.S. patent expiry in 2027 and an IRA-negotiated Medicare price effective January 1, 2026 [16].
To hold revenue flat to 2030, Pfizer must replace this block from its pipeline and business development — its Seagen (oncology) and Metsera (obesity) acquisitions target areas the company itself calls "extremely competitive" [17]. Whether that replacement succeeds is an execution question, and execution is not a year-10 moat.
Pricing Reform and Other Threats
Beyond the cliff, three named threats bear on the year-10 case, and none is cyclical.
Regulatory pricing reversal. The IRA gave Medicare authority to set prices on selected drugs; Eliquis was in the first ten, with its negotiated price effective January 2026 [18]. The IRA's Part D redesign is already visible as lower net price across Vyndaqel, Ibrance, Xtandi, Xeljanz and Lorbrena in 2025 [19]. Layered on top, a May 2025 executive order on "Delivering Most-Favored Nation Prescription Drug Pricing" led to a September 2025 agreement in which Pfizer voluntarily agreed to lower certain U.S. prices toward developed-market levels [20]. This is a widening, one-directional headwind on the very U.S. margins that fund the pipeline.
Substitution in the growth category. The largest current growth pool in pharma is obesity, and Pfizer is behind. Its oral GLP-1 danuglipron produced disappointing Phase 2b data and was later dropped; the Metsera acquisition is a re-entry into a market Lilly and Novo Nordisk already lead. This is the closest thing to an "your margin is my opportunity" dynamic in Pfizer's portfolio, and Pfizer is on the wrong side of it.
COVID volatility. Comirnaty ($4.4B, down 20% operationally) and Paxlovid ($2.4B, down 59%) remain material and inherently unpredictable — Paxlovid revenue "may fluctuate based on the timing, duration and severity of COVID-19 infections" [21]. A real search of the corpus found these threats named and quantified; they are not hypothetical.
Free Cash Flow Consistency
The framework's P2 test — a stable rolling 5-year average of adjusted FCF — cannot be computed here. The feature file returns fcf_stability and adjusted_fcf as not_computable: stock-based compensation is missing for every fiscal year 2016–2025 in the data feed, so the adjustment (FCF − SBC − 5-year-average acquisitions) and its rolling average cannot be formed. That is a data gap, stated as one, not a finding.
Reported free cash flow is available and tells a coherent, non-random story.
Source: fit_features.adjusted_fcf (reported free cash flow component; the SBC and acquisition adjustments are not computable). Derived from company cash-flow statements.
Three observations. The series is not unpredictable in the random sense — it has one obvious driver: a pre-COVID band of $10.5–14.8B (2016–2020), a windfall spike to $26–30B (2021–2022), a sharp $4.8B trough in 2023 as COVID unwound alongside deal and inventory charges, and a settle to $9–10B (2024–2025). There are no negative years. But the pattern is not the healthy insurance/banking underwriting cycle the framework tolerates — there is no 5–8 year mechanical loss cadence here; it is a one-off pandemic distortion. And the level matters for year-10: settled FCF near $9–10B now runs below the pre-COVID $12–15B, even though the base business is larger — the difference absorbed by higher interest on $63.5B of net debt, IRA pricing, and reinvestment. Capital allocation is explicitly de-levering first: repurchases come "after de-levering our balance sheet" [22], a priority tension the Self-Help tab examines.
The Year-Ten Case
The strongest case that year-10 revenue and FCF are higher. Pfizer has grown through patent cliffs before — it absorbed the Lipitor loss and the 2018–2020 stagnation and remains, at 176 years, a survivor of every prior cycle. Its base business ex-COVID grew from $45.7B to $54.5B across 2023–2025 [23], and 2026 guidance is for roughly 4% operational growth in the business excluding COVID and loss-of-exclusivity products [24]. A ~$10.4B annual research-and-development engine plus the Seagen oncology and Metsera obesity platforms is the standing bet that the pipeline out-runs the cliff. Demand for the underlying therapies does not disappear in any macro state.
The strongest doubt. The company's own 10-K forecasts a significant and accelerating revenue reduction from patent expiries through 2030 [25], covering roughly a third of current revenue, with the single largest product losing exclusivity and taking a mandated Medicare price at the same time. Replacing that block depends on pipeline and M&A outcomes that are unknowable today, in therapeutic areas Pfizer itself calls extremely competitive — while IRA and most-favored-nation pricing widen a permanent headwind on the U.S. margins that fund the refill.
The gate is binary by construction and demands very high conviction that both year-10 revenue and adjusted FCF exceed today's. On this evidence, that conviction is not available: the year-10 gate does not hold, on genuine doubt centered on whether an admitted, accelerating 2026–2030 patent cliff plus one-directional pricing reform can be out-run by a pipeline that must be refilled through execution. This is a doubt about conviction, not a verdict of decline — the structural-decline disqualifier is absent, and the base business is growing. Under Ruchir's own rule, a proper doubt is enough to fail the gate. What would change the read: durable, contracted replacement revenue visible before 2028 — pipeline approvals or business-development revenue large enough to cover the named LOE block — alongside stabilizing net price against the IRA and MFN pressure.
Self-Help
Pfizer can outlast its patent-cliff problem: investment-grade, gross leverage near 2.7x, only about $3.0B of debt due in 2026 against roughly $20B of liquidity, with the maturity wall pushed decades out. What it cannot presently do is run the buyback flywheel. Repurchases stopped after 2019, about $3.3B of authorization sits unused, the share count is drifting up on stock compensation, and cash is pre-committed to a ~$9.8B dividend and debt paydown. The dividend is defended but, in cash terms, is covered by asset sales rather than free cash flow.
The balance sheet against the problem's duration
The problem here is a multi-year loss-of-exclusivity (LOE) cliff — Eliquis, Vyndaqel, Ibrance and others rolling off through the late 2020s — layered on top of the debt Pfizer took on to buy Seagen. Long-term debt jumped from about $33B at the end of 2022 to roughly $62B once the $43.4B Seagen acquisition was funded, largely with $30.8B of new notes issued in 2023 [1]. At year-end 2025 total debt was $64.8B against $1.1B of cash, for net debt of $63.5B [2].
Net Debt ($B)
Gross Leverage (x, per mgmt)
Liquidity ($B)
Debt Due 2026 ($B)
Sources: net debt and near-term maturity from FY2025 10-K balance sheet and debt note [3] [4]; gross leverage of ~2.7x per management on the Q3 2025 call [5]; liquidity is cash of $1.1B plus $12.5B short-term investments plus the $7.0B undrawn revolver.
The maturity schedule is the reassuring part. Read year by year from the debt footnote, nothing in the near term threatens a company generating $11–13B of operating cash flow. The current portion — about $3.0B — comes due in 2026, then $2.6B in 2027, $5.7B in 2028, $2.6B in 2029 and $6.3B in 2030. More than half the principal, roughly $33.7B, does not mature until 2036 or later, stretching all the way to 2065 [6].
Source: FY2025 10-K, Note 7D senior unsecured long-term debt by maturity; 2026 bucket is the current portion of long-term debt [7].
Refinancing risk is real but contained. The sub-3% notes issued in the low-rate era roll off into new paper at higher coupons — Pfizer's 2025 issuance carried coupons up to 5.7% on the 2065 tranche [8] — so interest expense grinds higher as the book turns over, but the amounts and timing are manageable. The debt is rated high-quality by both S&P and Moody's [9], and there are no financial-covenant tripwires disclosed; liquidity is deep — $1.1B cash plus $12.5B of short-term investments plus a fully undrawn $7.0B revolving facility maturing in 2030 [10].
The deterministic balance-sheet classifier returns unknown because EBITDA was missing from the structured feed; management's own stated gross leverage of about 2.7x [11] places it in the moderate band, below the framework's ~3.0x levered threshold. So the balance sheet comfortably outlasts the LOE cliff. The bind is not solvency; it is allocation headroom. Management now expects leverage to "remain around the current levels or even slightly higher through the transition period" of the LOE cliff [12] — meaning the debt does not come down materially over the very years the repurchase tailwind would be strongest, because operating cash is already spoken for by the dividend, ongoing business development, and holding the line on leverage.
The repurchase record — executed, not authorized
This is where the framework's self-help test bites. Pfizer bought back stock in size through 2019 — $12.2B in 2018 and $8.9B in 2019 on the repurchase history [fit_features.share_count_trend.buyback_cash_per_year] — then stopped. Since 2020 the only repurchase was a token $2.0B in 2022, with 2021 and 2023 both zero in the cash-flow statement [13], and 2024 and 2025 also zero [14], Item 5 Issuer Purchases of Equity Securities — p.70"), Item 5 Issuer Purchases of Equity Securities — p.70").
Source: cash actually spent on repurchases from the Consolidated Statements of Cash Flows, FY2023 and FY2025 10-Ks [15], Consolidated Statements of Cash Flows — p.114"), Consolidated Statements of Cash Flows — p.114") [16], Item 5 Issuer Purchases of Equity Securities — p.69"), Item 5 Issuer Purchases of Equity Securities — p.69"); values match fit_features.share_count_trend.buyback_cash_per_year.
The authorization is intact but idle. As of year-end 2025 approximately $3.29B remained available under the repurchase plan, and Pfizer executed nothing against it during the year — the only common-stock purchases in the fourth quarter were 132,731 shares tied to employee tax withholding and dividend reinvestment, none under the announced plan [17]. This is an authorization noted as exactly that: capacity on paper, no execution.
With buybacks off, the share count has gone the wrong way. Diluted weighted-average shares fell from 6.16B in 2016 to a low of 5.63B in 2020, then drifted back up to 5.71B by 2025 as stock-based compensation issued new shares with nothing repurchased to offset it — a 5-year share-count CAGR of +0.29%, rising rather than shrinking [fit_features.share_count_trend].
Source: diluted weighted-average shares from fit_features.share_count_trend, cross-checked to the FY2025 10-K income statement (5,713M diluted, FY2025) [18].
A rising share count with the buyback engine switched off is the condition the framework treats as a self-help failure. Pfizer's share count has risen at roughly 0.3% a year over five years while repurchases sat at zero — the flywheel is not merely paused, it is pointed the wrong way. The mitigating fact: the count is still below where it stood a decade ago, and the drift up reflects modest stock compensation, not serial equity issuance for M&A.
The deeper reason the self-help case does not compute is where the cash goes. Pfizer is a serial acquirer, and the framework's "real" free-cash-flow basis — reported FCF minus stock compensation minus the trailing five-year average of acquisition spend — is not computable in the feature file because the structured feed lacked the SBC and acquisition series. Rebuilt from the filed cash-flow statements, the picture is stark: acquisitions ran $23.0B in 2022, $43.4B in 2023 (Seagen) and $6.9B in 2025 (Metsera), for a five-year average of about $14.7B a year [19] [20]. Against reported FCF of $9.1B and stock compensation of just $0.8B in 2025 [21], subtracting a $14.7B average acquisition outlay leaves no positive adjusted figure at all. Pfizer consumes more cash acquiring pipeline than it frees up — the opposite of a company routing cash into its own shares. (See the adjusted-yield mechanics in Yield.)
Management's buyback intent, from the record
Management has been explicit that repurchases are last in line, behind deleveraging, the dividend, R&D and business development. The clearest statement came on the Q3 2025 call, when a broker asked directly when buybacks might resume:
"Additionally, share repurchases are an important option for us, but in the short term, we won't be utilizing this tool. We need to strengthen our balance sheet first, as there are business priorities that take precedence right now." — David Denton, CFO, Q3 2025 call [22]
The capital-allocation language has, if anything, demoted buybacks over time. Through 2024 the stated order ended with "value-enhancing share repurchases after delevering our balance sheet" [23]; by Q1 2026 it had softened to "preserving optionality for future value-enhancing actions, including share repurchases" [24]. The one forward hint is that, with litigation overhangs clearing, "share repurchases will come back into greater consideration going forward" — but no timing, and not before the balance sheet is further strengthened [25].
Insiders have not stepped in either. Across roughly 17 months of Form 4 activity through July 2026 there was not a single open-market purchase by an officer or director — 145 of 147 transactions were equity grants or tax-withholding dispositions, with two small open-market sales [insider_activity.json]. There is no insider-buying signal to put alongside management's "consideration going forward."
The levered exception does not apply
The framework tolerates a levered balance sheet with no buybacks only when the adjusted yield is very high (~25%+) and there is a demonstrated multi-year share-count reduction and FCF/revenue is not deteriorating — all three legs, not two. Pfizer clears none cleanly. Gross leverage of ~2.7x is moderate, not the ~25–40% levered-yield regime the exception was written for; the share count is rising, not falling; and revenue and FCF fell hard off the COVID peak (revenue from $91.8B in 2022 toward ~$62B, FCF from $26–30B to ~$9B). The levered path that fit Charter — a halved share count over a decade on a massive yield — is absent here.
The absurdity check
At the current price the entire float is not close to cheap on a cash basis. The float_retirement_years feature is not computable because it requires a positive adjusted FCF, which does not exist here. On reported FCF the arithmetic is straightforward and clearly not absurd: the $140.8B market cap divided by $9.1B of FY2025 free cash flow is about 15.5 years to retire the float; even on the more optimistic consensus forward FCF of roughly $20.6B for 2026, it is about 6.8 years [fit_features.consensus_forward_yield]. The framework's absurdity trigger is around three years — where the price is making a claim that cannot survive. Pfizer is nowhere near that: this is a moderate yield with the cash already committed elsewhere, not a mispriced float the company could obviously retire in a handful of years.
Reported-FCF float-retirement is shown as an illustration only; the adjusted-FCF feature and float_retirement_years are recorded as not computable — see the data gaps.
Dividend safety
The dividend is a material part of any return case here — at $1.72 a share against a $24.64 price, the yield is about 7.0% — so it deserves a full look. Pfizer has raised the dividend every year through the downturn, from $1.57 in 2021 to $1.72 in 2025 [26], and management calls it "a very important and critical structural component of our capital allocation program," committing to "maintaining our dividend at the moment and growing our dividend over time" [27].
The coverage, though, is thin on cash. Dividends paid have climbed to $9.8B while free cash flow has fallen to about $9.1B, so 2025 cash coverage was roughly 0.93x — the dividend cost slightly more than free cash flow generated. 2024 was 1.03x, and the COVID-cliff year 2023 was just 0.52x [28].
Source: free cash flow and cash dividends paid from the Consolidated Statements of Cash Flows, FY2023 and FY2025 10-Ks [29] [30], Consolidated Statements of Cash Flows — p.114"), Consolidated Statements of Cash Flows — p.114"); FY2021–22 FCF from fit_features.adjusted_fcf.
Two things keep this from reading as an imminent cut. First, on earnings the payout is comfortable: the $1.72 dividend against adjusted diluted EPS of $3.22 is about a 53% payout [31]. Second, the cash gap has been plugged by asset sales rather than borrowing — Pfizer took in $7.0B in 2024 and $6.3B in 2025 from selling down its Haleon stake [32]. That is also the vulnerability: once the Haleon monetization is exhausted, the dividend leans entirely on a free-cash-flow line that has to climb back above $9.8B through the worst of the LOE cliff. What would force a cut is a sustained stretch of FCF below the dividend with no asset-sale offset — visible in the "dividend growth pause" analysts have already flagged, with the raise slowed to about a penny a quarter. The dividend is defended and, on earnings, covered; on cash it is covered only with help.
Management credibility
The promise-versus-delivery record is mixed rather than promotional, and the sample matters. Take the five most material commitments from the 2022–2025 calls:
1. FY2023 revenue guidance — a large miss. Management guided to a $67–70B revenue range; by October that was cut to $58–61B, and the year landed near $58.5B [33]. A roughly $10B forecasting error in one year.
2. Paxlovid "transition year" — reversed, not smoothed. The 2023 COVID-inventory normalization management framed as an orderly transition instead produced a $3.5B fourth-quarter revenue reversal and $6.2B of COVID-related inventory write-offs recorded in 2023 [34].
3. Cost realignment — delivered on schedule. The ≥$3.5B net-savings program announced in October 2023 was raised to ≥$4B and delivered on plan by early 2025, with the program later extended to $5.7B by 2026 [35] [36]. Kept.
4. Deleveraging — ahead of target. The 3.25x gross-leverage goal set for end-2025 was reached early, with leverage brought from about 4x to ~2.7x [37]. Kept.
5. Dividend — maintained and raised every year through the cliff [38]. Kept.
So the operational and capital commitments — cost, leverage, dividend — were delivered; the misses cluster in the 2023 COVID-demand collapse, which was an industry-wide forecasting error rather than a pattern of over-promising on the base business. That is different from the promotional-CEO profile the framework excludes. What weighs on the other side is the shareholder outcome and the governance response: including dividends, Pfizer stock returned to $86.4 on a $100 2020 base by the end of 2025, while its pharma peer group reached $211 and the S&P 500 reached $196 [39], and activist Starboard Value engaged in 2024 explicitly dissatisfied with total shareholder return and Pfizer's capital deployment for business development [40]. The absence of any insider open-market buying through the drawdown [insider_activity.json] is consistent with that: management has defended the dividend and hit its cost and leverage marks, but neither its record on capital deployment nor its own buying makes the self-help case for it.
The read this tab establishes: the balance sheet can wait out the problem, but capital allocation is committed to the dividend and to holding leverage flat, not to repurchases — and with the share count drifting up and the buyback authorization unused, the self-help flywheel the framework looks for is not turning. What would change it is a resumption of buybacks at scale with the share count inflecting down, which management has deferred to an unspecified "going forward."
Clock
For Pfizer, the gap-closing mechanism is not a clean industry-repricing cycle. The visible near-term levers — COVID-comparison normalization and a $7.2 billion cost program — are already in motion and have not re-rated the stock; the buyback lever is switched off through 2026; and the events the market fears (Eliquis, Ibrance, Xtandi and Xeljanz losses of exclusivity, plus IRA-negotiated prices) land inside the next 18 months, with the offsetting pipeline framed as a 2030 story. This name's own drawdowns of comparable depth took years — not quarters — to reclaim. Consensus is neutral: a $28.75 mean target and a mostly-Hold book, with earnings expected to keep falling through 2027. Long-dated options exist and implied volatility is low.
The re-rating mechanism — what would close the gap, and when
Ruchir's framework looks for a specific engine of re-recognition: an industry that reprices on a calendar, a cost drag that rolls off, guidance resetting against a low bar, buybacks shrinking the share count, or a feared event that fails to arrive. Pfizer presents pieces of several — but each carries a timing problem.
COVID normalization rolling off — in motion, 2026–2027. The reported top line is still shrinking because the pandemic franchises are deflating: full-year 2025 revenue of $62.6 billion fell 2% operationally, but excluding Comirnaty and Paxlovid the base business grew 6% operationally for the year [1], and 9% in the fourth quarter alone [2]. As the COVID comparisons anniversary, reported growth should re-surface. This is the one mechanism whose window plausibly falls inside 18 months.
Cost normalization — in motion, 2026–2027. Pfizer has a multi-part productivity program targeting roughly $7.2 billion of total net cost savings, the majority delivered by the end of 2026, with an additional ~$1.5 billion from a manufacturing-optimization phase by the end of 2027 [3]. Management says it exceeded its 2025 savings targets. The savings support the margin, but 2026 guidance already banks them: adjusted EPS is guided to $2.80–$3.00 against a stable-margin assumption [4].
Guidance beating a low bar — firing every quarter, without effect. Pfizer has reset guidance low and beaten it by wide margins for six consecutive quarters — reported adjusted EPS surprises of +37%, +36%, +36%, +37%, +16% and +4% across 2025–2026 prints. The stock has not re-rated on any of them; it has traded in a $23–$28 band since the April 2025 trough. On this name, the low-bar-beat mechanism is already exhausted as a catalyst.
Source: reported EPS vs. consensus, company earnings calendar (yfinance:PFE), Feb 2025 – May 2026.
Buybacks shrinking the denominator — off the table through 2026. The capital-allocation framework ranks the dividend first, business development second, and share repurchases only "in the future"; the company completed no buybacks in 2025, holds a $3.3 billion residual authorization, and its 2026 guidance "does not anticipate any share repurchases in 2026," while it de-levers the post-Seagen balance sheet [5]. The share-count-shrink lever that Ruchir's dislocation case relies on is absent here (the mechanics are in Self-Help).
The feared events land inside the window, not after it. The overhang is a concentrated patent cliff: U.S. basic-patent expirations for Eliquis, Ibrance and Xtandi in 2027, and Xeljanz and Vyndaqel around 2026 [6], layered on IRA Medicare-negotiated "Maximum Fair Prices": Eliquis effective January 1, 2026; Ibrance and Xtandi effective January 1, 2027; Xeljanz effective January 1, 2028 [7]. Re-rating on "a feared event failing to happen" does not fit: these events are scheduled, not speculative. The bull mechanism instead requires the market to conclude the pipeline bridges the cliff — management frames roughly 20 pivotal study starts in 2026 and "industry-leading growth at the end of the decade" [8], with a stated ambition that the current pipeline could deliver 8+ blockbusters by 2030 [9]. That is a multi-year proof, not an 18-month one.
Dated calendar. Next print: Q2 2026 earnings on August 4, 2026. IRA price steps: Eliquis Jan 2026, Ibrance/Xtandi Jan 2027, Xeljanz Jan 2028. Patent expiries cluster 2026–2028.
Base rates from Pfizer's own history
The long price record is the sober counterweight. Pfizer has fallen 30% or more from a swing high six times since 1998; the question base rates answer is how deep those episodes ran, how long they took to trough, and — the part that matters for an 18-month instrument — how long from the top back to the top.
Source: derived from the run's daily price series, 1990–2026 (data/prices/daily.json); episode peaks/troughs identified by a 25%-reversal zigzag filter.
Source: derived from the run's daily price series, 1990–2026 (data/prices/daily.json); "reclaim" is the first close at or above the prior swing peak.
Two facts stand out. First, the current episode is the deepest in the record: the all-time high of $61.25 (December 16, 2021) to the trough of $21.59 (April 10, 2025) is a 65% decline, and 4.6 years on the stock has not reclaimed it. Second, reclaiming a peak has historically taken this name 3 to 22 years — the 1999 high of $47.44 was not durably exceeded until August 2021, a 22-year wait. Full round-trips are a decade-scale phenomenon here, not an 18-month one.
The more framework-relevant base rate is the partial rebound off a capitulation trough — the Centene-style move from the bottom rather than back to the old high. Those exist and are faster:
Source: derived from the run's daily price series (data/prices/daily.json); trough-to-next-swing-high legs. The current leg's $28.32 high (April 2026) has already faded back to $24.64.
Rebounds of 38% to 127% inside 9–21 months are in the record — but the two largest (2009, 2020) followed genuine, volume-confirmed capitulation (the global financial crisis and the COVID crash). The current episode is different: the deterministic capitulation gauge measures the recent leg as a 31% fall from the July 2024 local peak of $31.39 on a volume spike of only 1.9× normal — below the forced-selling threshold — and the rebound off the April 2025 trough has already stalled, moving from $21.59 to $28.32 and back to $24.64 (drawdown and volume gauge derived from data/ruchir/fit_features.json and the daily price feed). The fuller anatomy — who was selling, and whether the volume ever spiked to true capitulation — sits in Dislocation.
The 18-month test
Re-recognition within roughly 18–24 months would require a genuine capitulation trough already in place and a catalyst whose window fits — and only one of those conditions is clearly met. The single mechanism that fits the window is COVID-comparison normalization surfacing the ~6% base-business growth. Against it: the patent and IRA headwinds are concentrated in the same 2026–2028 window and pull the other way; the pipeline that would bridge the cliff is framed as a 2030 outcome; the buyback lever is off through 2026; and the price history shows this name reclaiming comparable drawdowns over years, not quarters, with the one recent volume gauge falling short of true capitulation. On the current evidence the path reads as multi-year cycle repair — the market waiting to see the cliff survived and the pipeline delivered — rather than an 18-month snap-back. This read would be wrong if the sector or the name reprices faster than its own history suggests — most plausibly if the 2026–2028 LOEs prove less severe than feared and the base business compounds visibly through the comparisons; that falsifier is carried in Fit.
What consensus expects, and when
The sell side is neither piled into the story nor negative on it — it has drifted to neutral. Twenty-eight analysts split 2 strong-buy, 8 buy, 16 hold, 1 sell and 1 strong-sell, essentially unchanged over three months, and the mean price target of $28.75 (median $28.00) sits about 17% above the $24.63 quote, with the low target at $24.00 — barely below spot.
Current price (Jul 24, 2026)
Mean target
▲ 16.7% Implied upside
Source: analyst price targets and recommendations, as of Jul 24, 2026 (consensus estimate feed, data/estimates/analyst_estimates.json).
The timing question — when consensus itself expects recovery to print — has an uncomfortable answer: not within its own forecast window. Consensus adjusted EPS is $2.94 for 2026 and $2.83 for 2027, both below the $3.22 Pfizer earned in 2025; consensus revenue likewise slips from ~$61.8 billion (2026) to ~$59.2 billion (2027). The printed numbers the sell side models keep declining through 2027.
Source: FY2025 adjusted diluted EPS as reported [10]; 2026–2027 figures are consensus means (data/estimates/analyst_estimates.json).
A re-rating usually needs a printed quarter that visibly inflects the trend. On these estimates, no such quarter falls before 2027–2028, when the COVID comparisons are fully clean and the size of the 2027 patent step is known. Consensus does, however, model free cash flow well above the reported earnings line — a forward FCF yield near 14–15% on the current market cap — which clears the framework's moderate-balance-sheet reference line even as EPS falls; that consensus-yield question, and whether it holds against a levered bar, is worked in Yield. Meanwhile the stock pays a $1.72 annual dividend — a ~7.0% yield at $24.64 — so the wait is partly funded; the coverage and safety of that dividend are examined in Self-Help.
Instrument facts
The following are dated facts about the listed-option market, stated as facts. Nothing here is a recommendation, a structure, or a sizing view; strikes and expiries are not suggested.
Long-dated listed options on Pfizer exist well beyond the 18-month horizon. January 2028 LEAPS are trading — roughly 858 days, about 28 months, to expiration — so contracts spanning the full base-rate window are available.
Liquidity is deep: total Pfizer option open interest was reported around 1.5 million contracts, above its 52-week average, consistent with one of the more heavily optioned U.S. large-caps.
Implied volatility is low. Pfizer's 30-day mean implied volatility was 0.252 (about 25%) as of July 23, 2026, with call IV ~0.254 and put IV ~0.250. Against the framework's reference lines — up to ~50–55 acceptable, 60–70 elevated — a ~25% reading sits well below the acceptable band, the low-IV profile of a large, slow-moving pharmaceutical rather than a name in acute fear.
Sources: PFE January 2028 Options Begin Trading, Nasdaq; PFE Open Interest Trends, Market Chameleon; PFE 30-Day Implied Volatility (Mean), AlphaQuery, as of Jul 23, 2026.
Qualifying long-dated instruments therefore exist, and their pricing is not elevated — the expression context does not itself obstruct a patient position. What the instruments cannot supply is the missing ingredient the rest of this tab identifies: a mechanism and a base rate that put re-recognition inside their life.